Step-by-Step Configuration
In our previous guide, you learned how to establish the core Bivocom ThingsBoard Platform Integration and build a basic monitoring dashboard. Now, let’s move beyond the basics. This article explores advanced dashboard customization, turning your platform into a powerful, tailored command center. Advanced customization turns generic data displays into tailored tools that align with your team’s workflows, industry needs, and stakeholder goals—all without coding expertise.
Refine Widget Data & Visuals
Moving beyond basic data display, this phase focuses on tailoring each widget for clarity and immediate insight. Precise configuration turns raw telemetry into actionable information.
1. Entities Table: Centralized Data Overview
This widget serves as your dashboard’s operational core, displaying key devices and their latest values. Utilize its built-in filtering, full-text search, and pagination to navigate data efficiently. Customize columns to surface only the most critical telemetry, ensuring immediate focus on what matters.
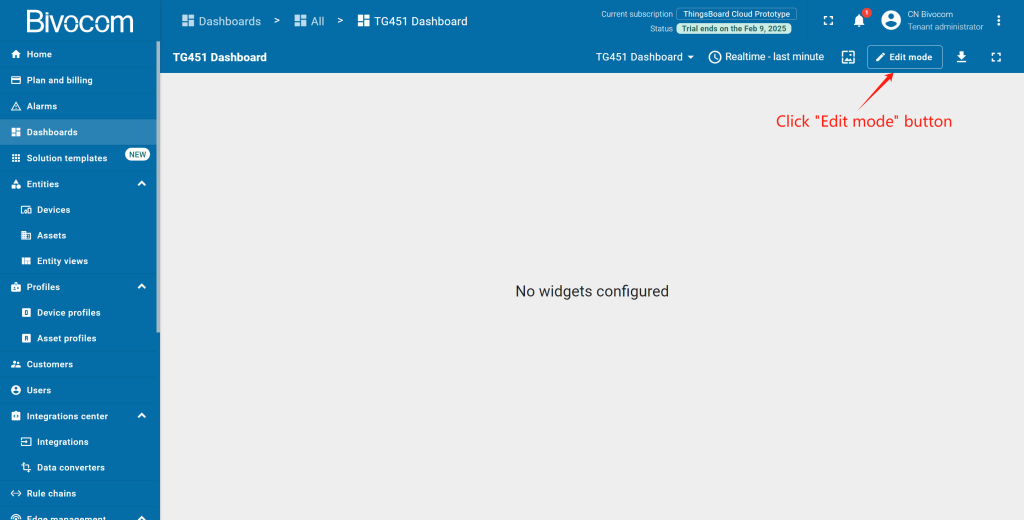
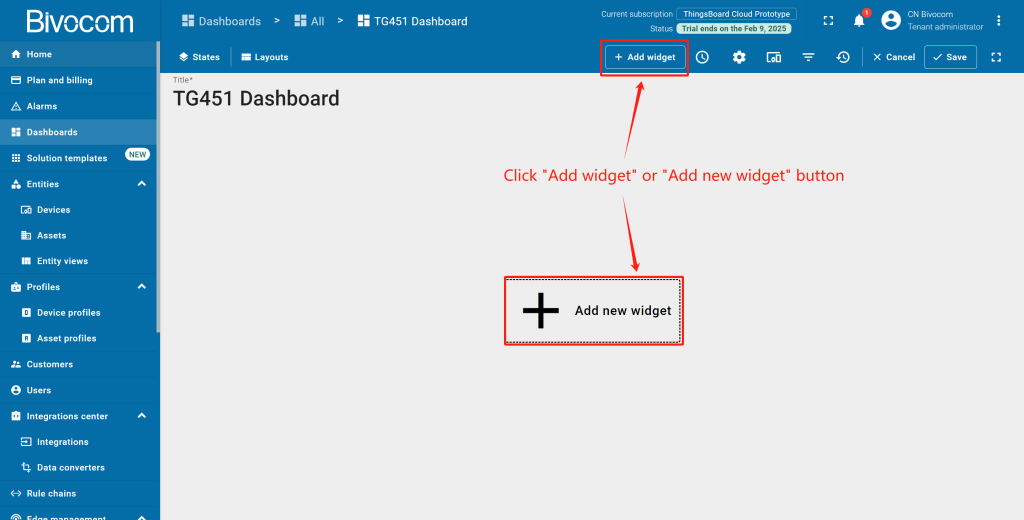
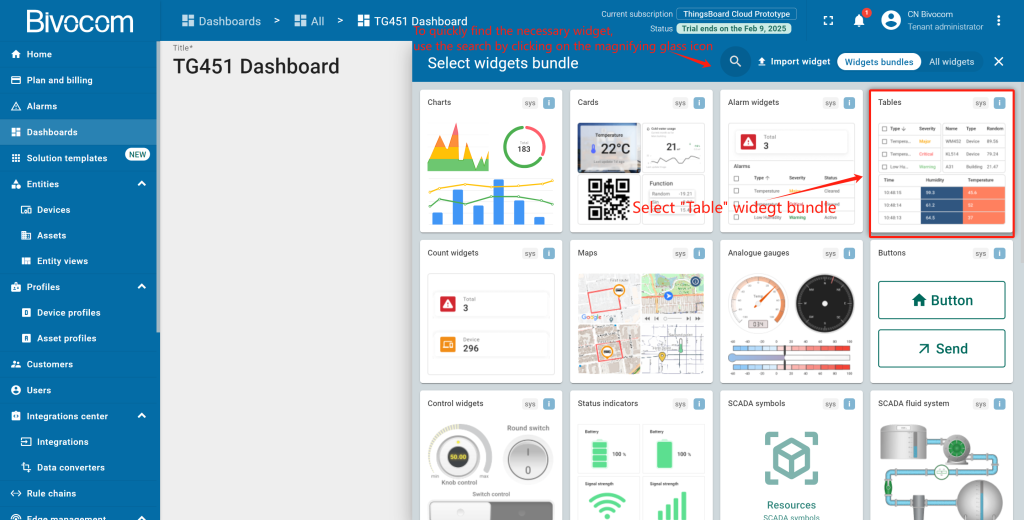
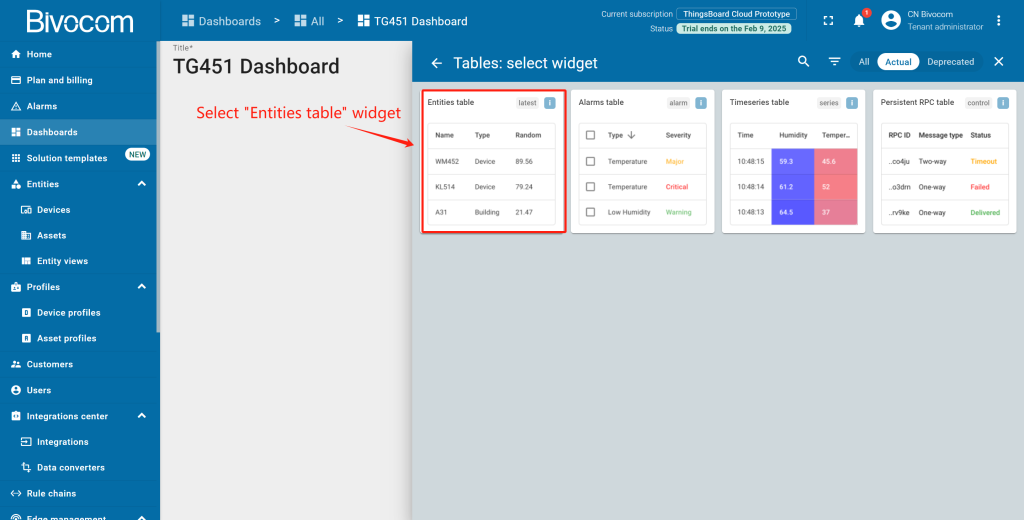
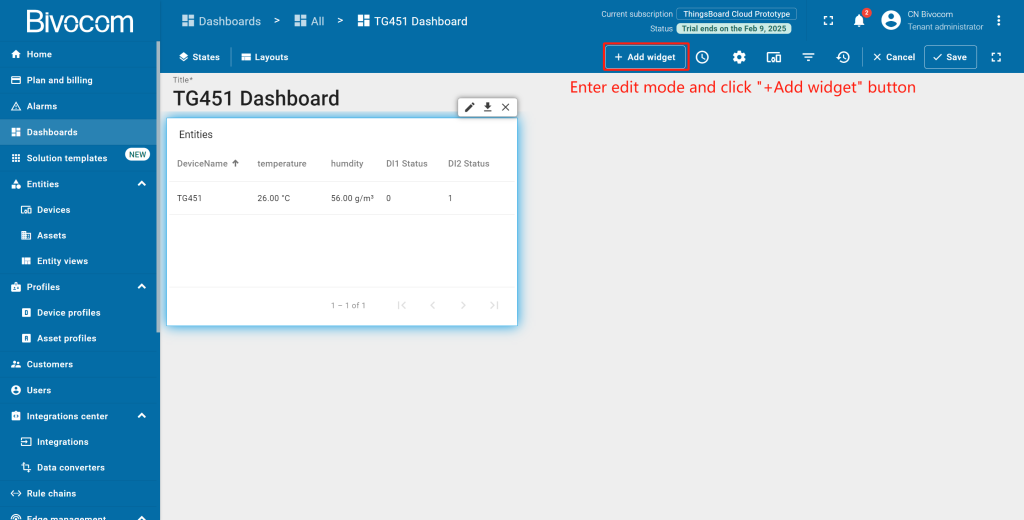
Navigate to your Bivocom ThingsBoard Dashboard and enter “Edit mode”. Click “Add widget” (top) or “Add new widget” (center, for empty dashboards) → “Tables” bundle → select “Entities Table”.
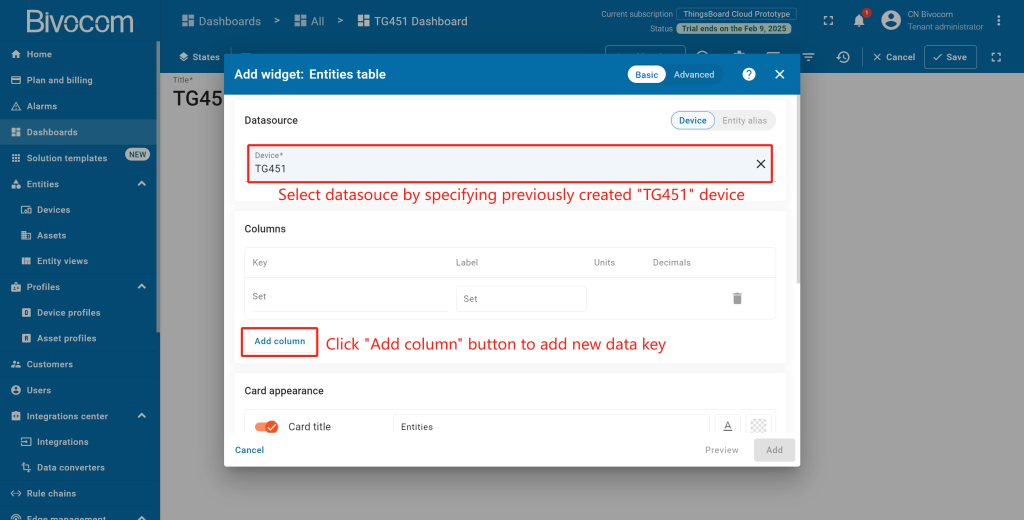
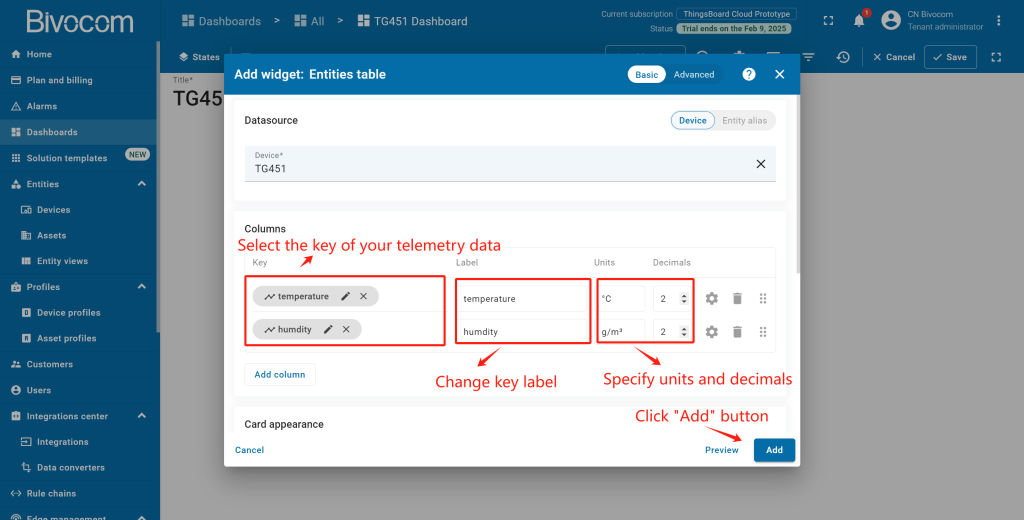
In the “Add Widget” window, set your preconfigured device as the data source in the “Device” field (the default column shows the device name). Click “Add Column” to enable telemetry display. In the new data key field, select your desired telemetry key from the list. Configure units and decimal precision as needed. Then click “Add”to finalize widget creation.
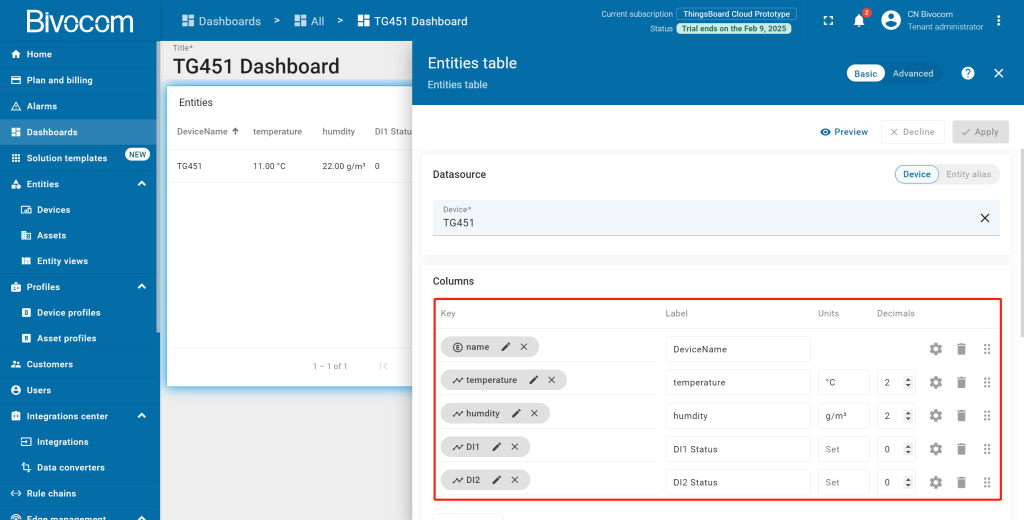
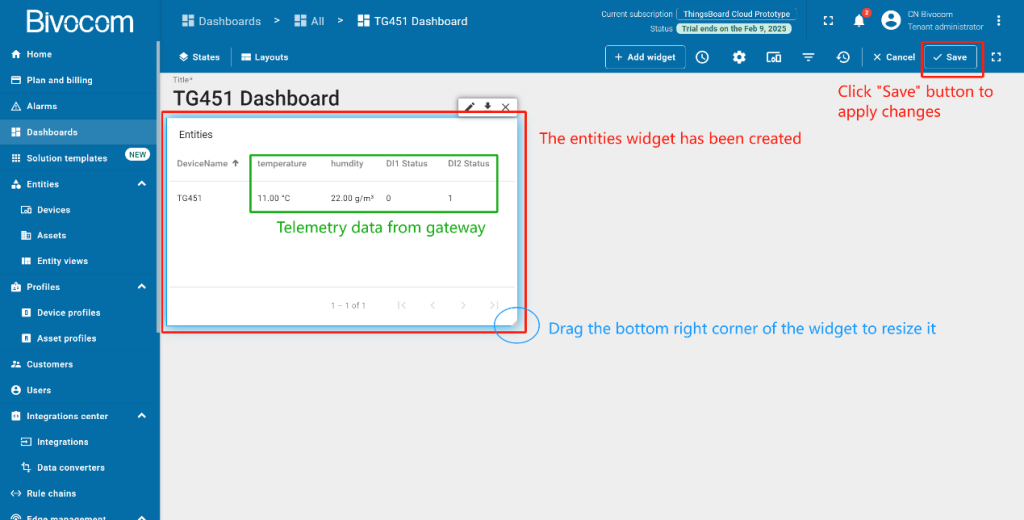
Monitor telemetry data directly in the widget; resize it by clicking and dragging its bottom-right corner for better visibility. Click “Save” (top toolbar) to persist your dashboard layout. In the “Entities table” widget, there are 5 columns. The first column displays the device’s name, and the other columns display the value of the telemetry key. Therefore, each column corresponds to an added key.
2. Chart: Trend Analysis
Convert raw telemetry streams into clear visual trends for performance analysis and anomaly detection. This widget plots historical time-series data using customizable line or bar charts over a defined time window.
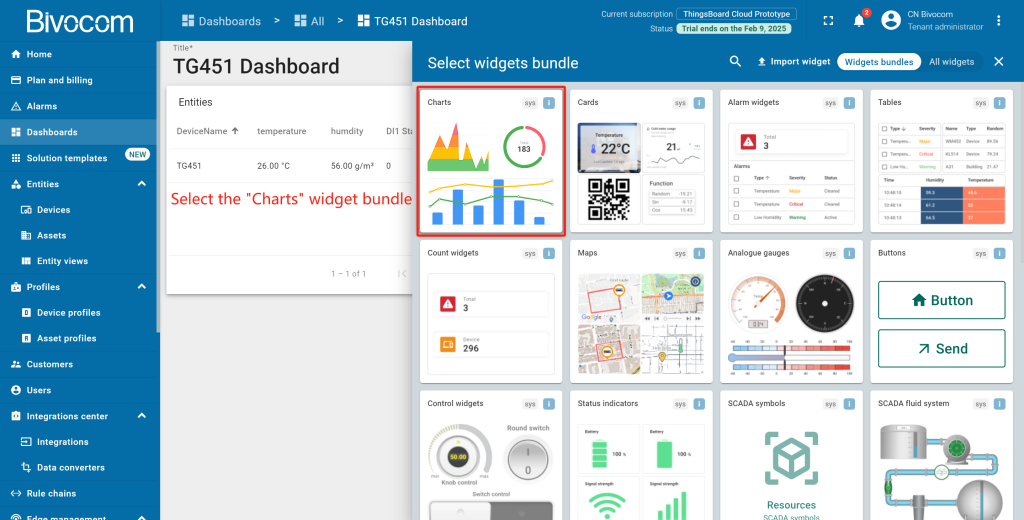
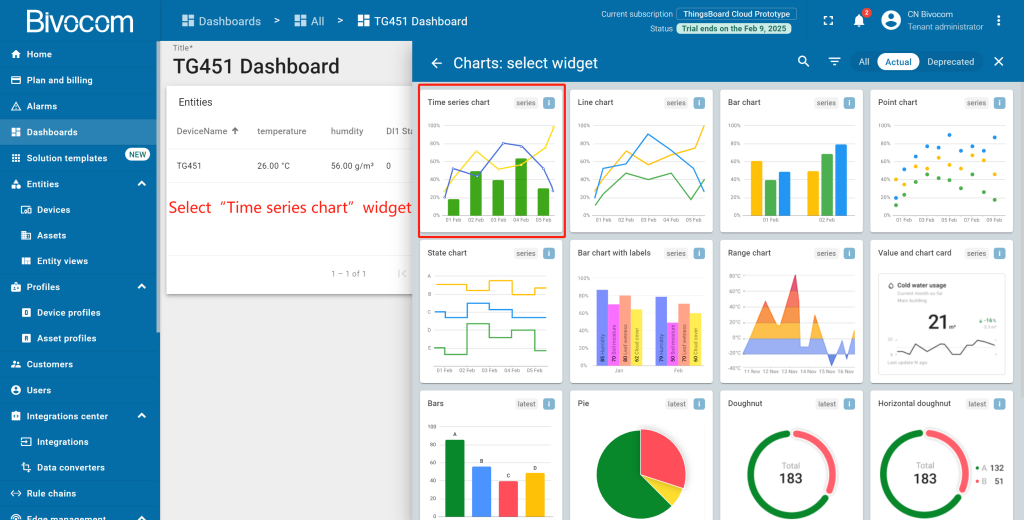
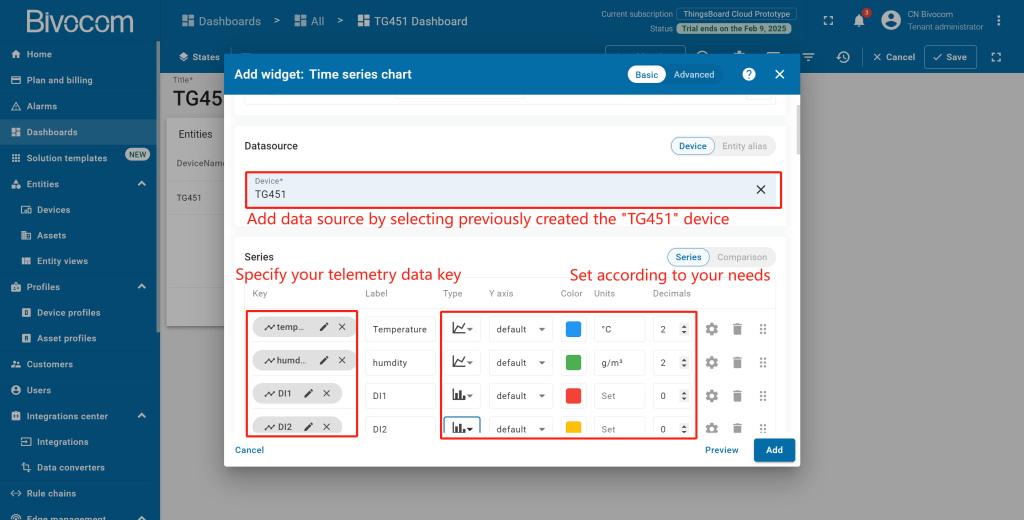
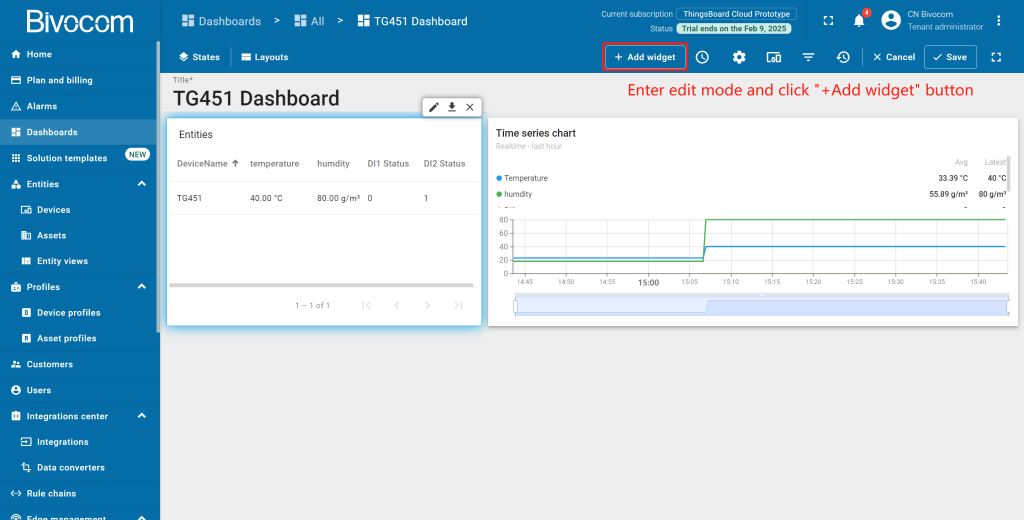
Enter edit mode, click “Add new widget” → find “Charts” bundle → select “Time series chart”.
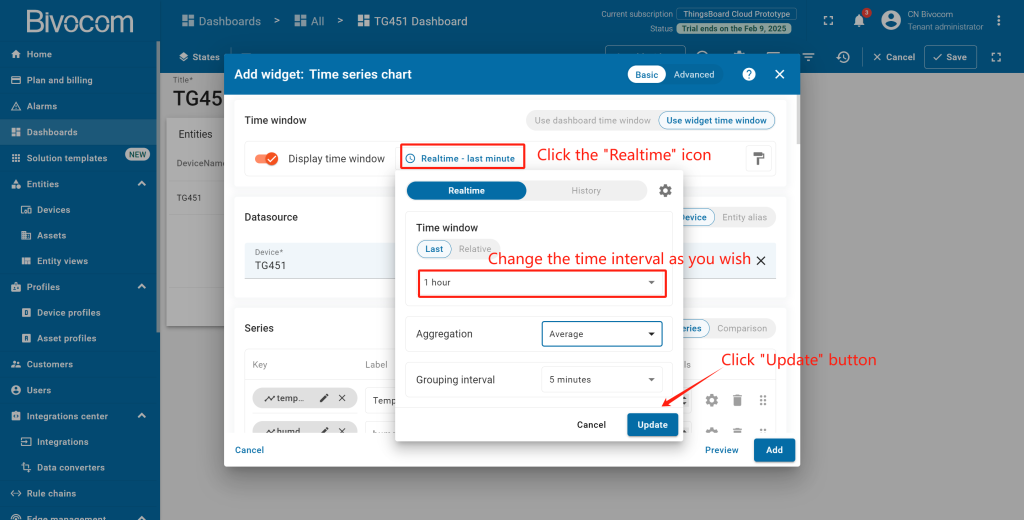
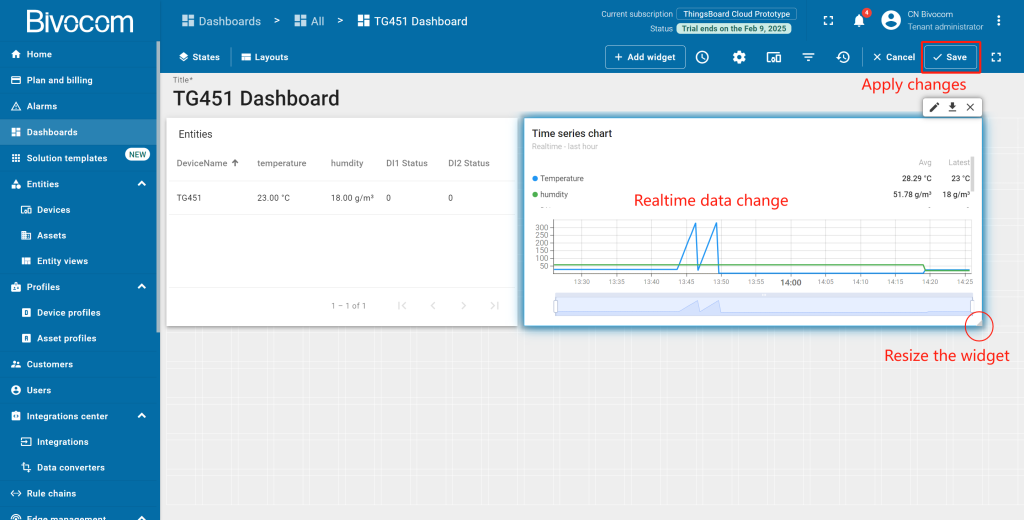
Specify the previously created device “TG451” as the data source in the “Device” field. In the “Series” section, specify the data key to start monitoring the telemetry values of the device. Click the “Realtime”, select the specific time interval from the drop-down menu, and click “Update” to save the change. Then click “Add” button. Resize the widget, and save. New telemetry readings will display in the chart in real time for the set time interval.
3. Timeseries Table: Timestamped Data Tracking
Essential for detailed audit trails and troubleshooting, this widget provides a timestamped log of all historical telemetry values for selected entities, offering a clear chronological record of device behavior.
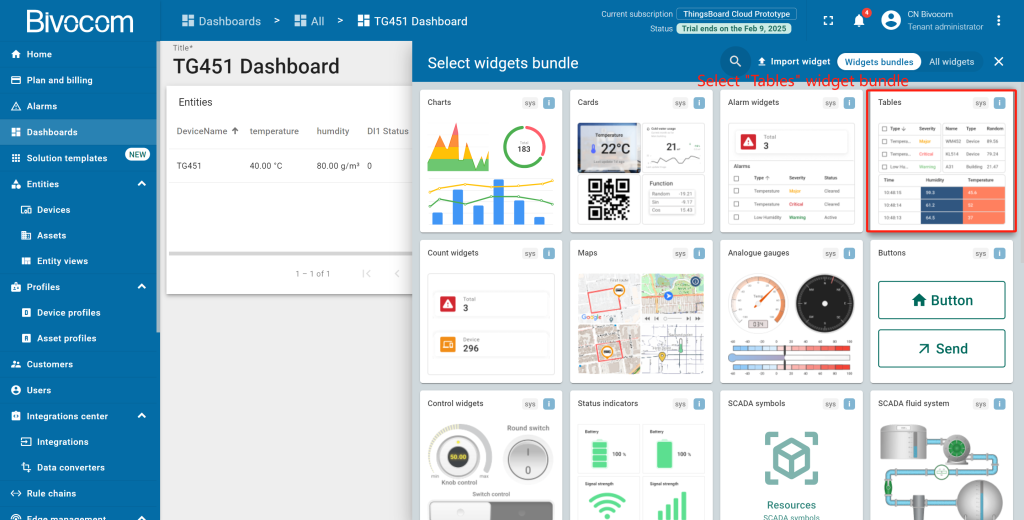
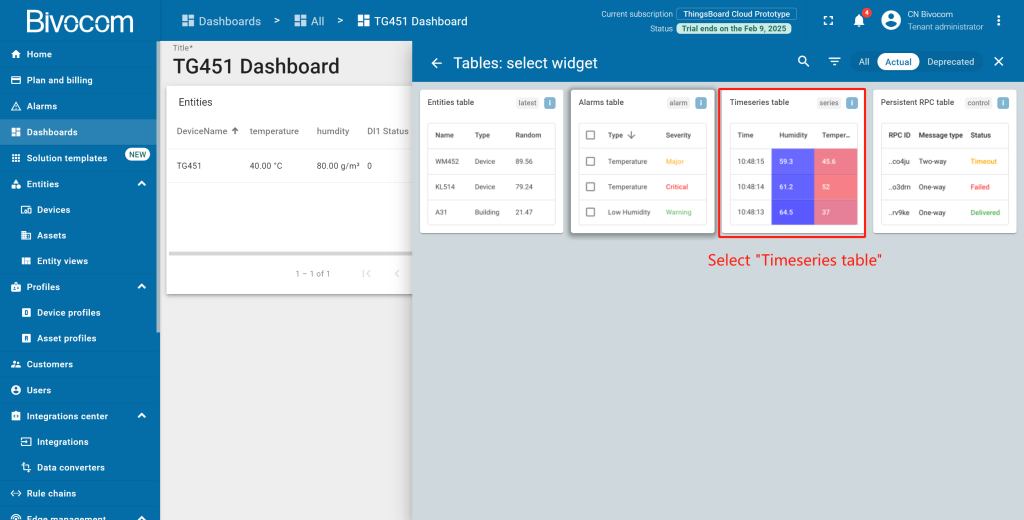
Enter edit mode, click “Add new widget” → find “Charts” bundle → select “Timeseries table”.
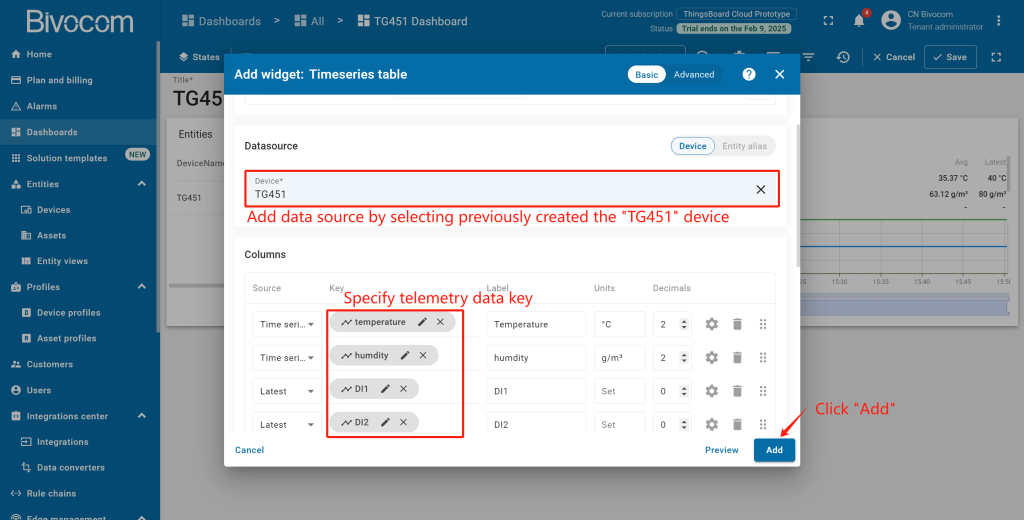
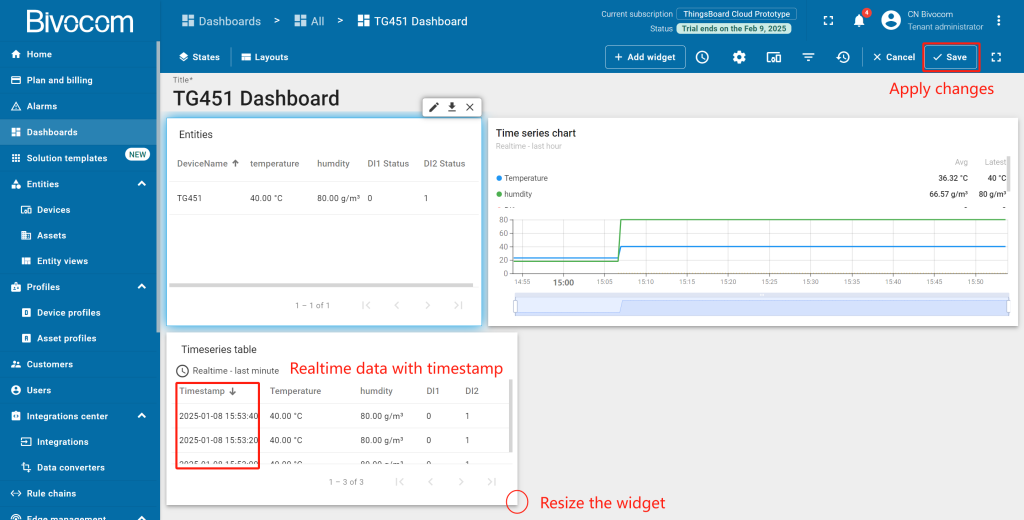
Set your Bivocom device as the data source → Select telemetry keys to monitor. Click “Add” → Resize the widget and save. The table will display real-time data with precise timestamps for easy viewing.
4. Alarms Table & Rule Configuration: Proactive Monitoring
Centralize alerts and set custom rules to trigger notifications when Bivocom telemetry hits critical thresholds.
① Add Widget
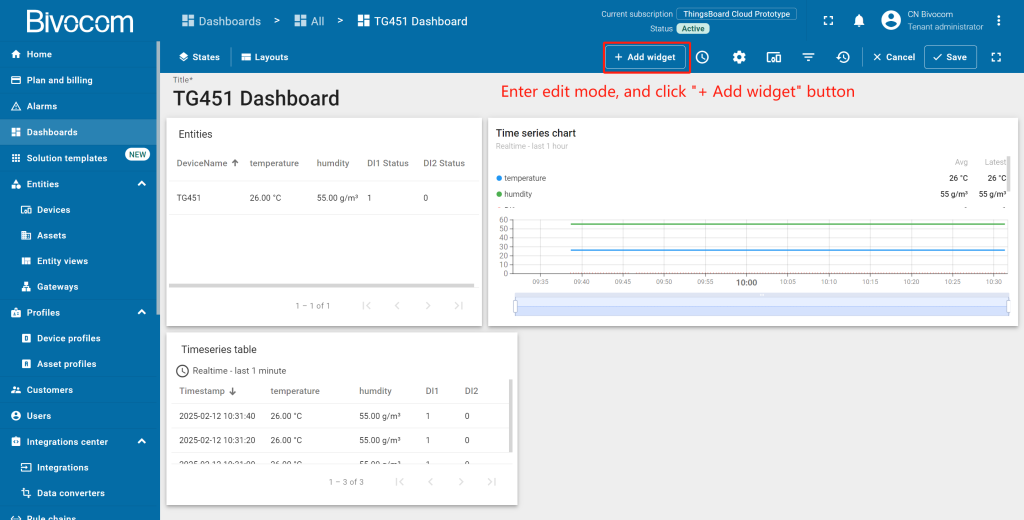
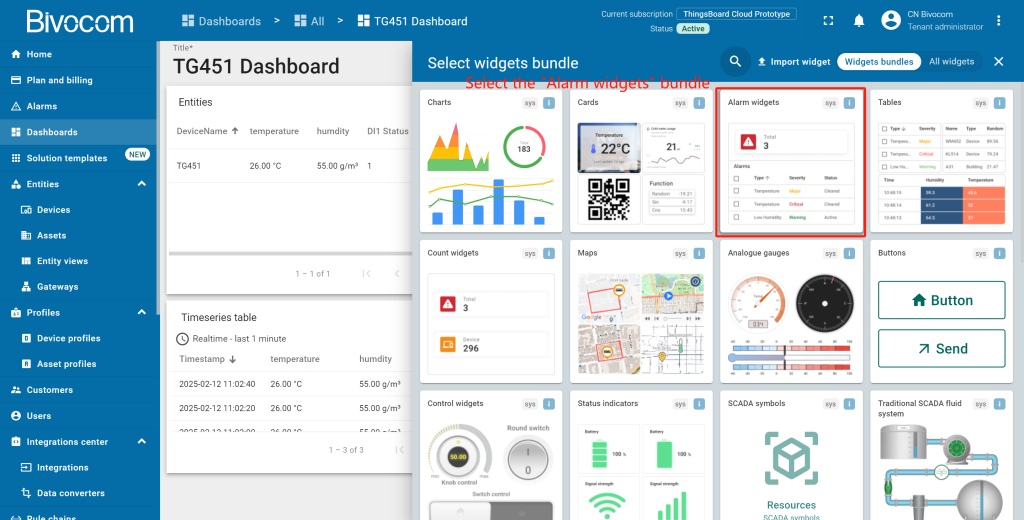
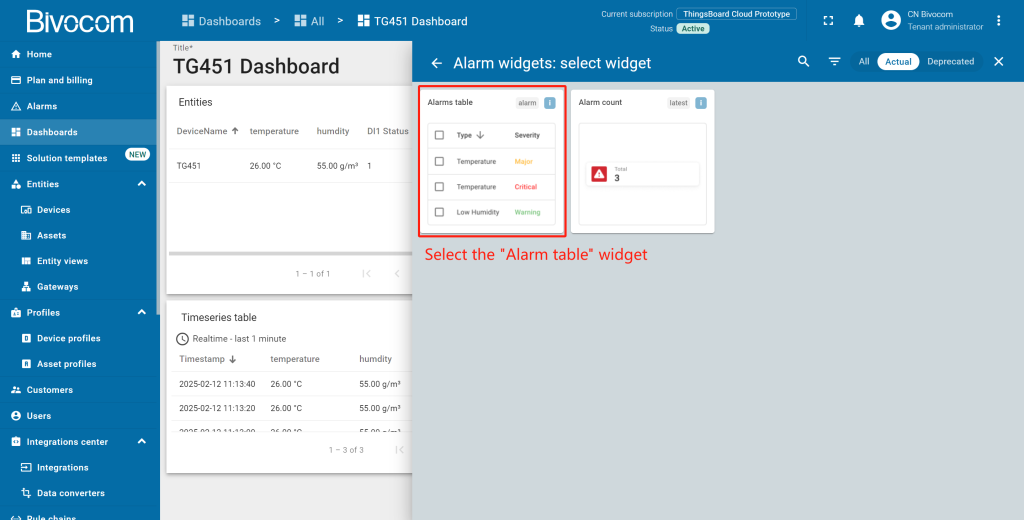
Enter edit mode, click “Add new widget” → find “Alarm widgets” bundle → select “Alarms table”.
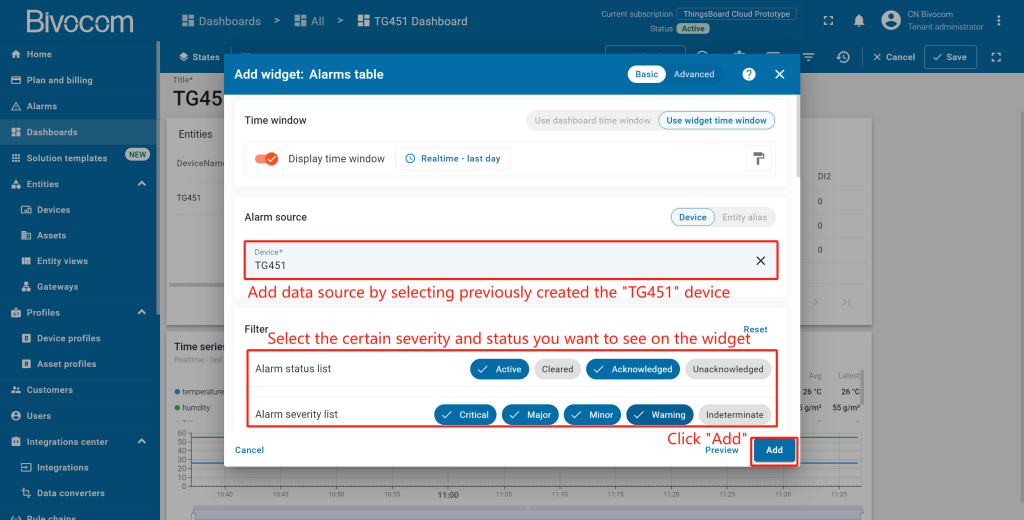
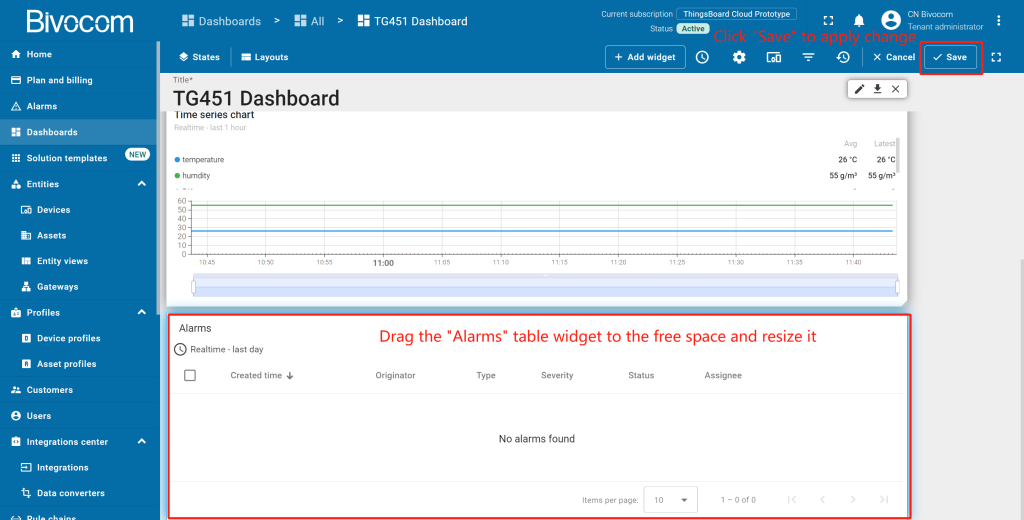
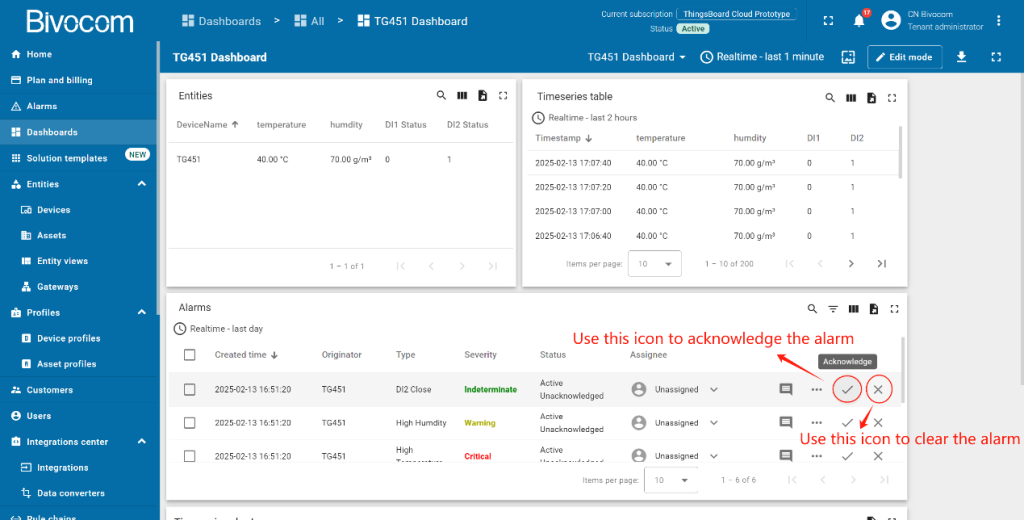
Set your Bivocom device as the data source → configure the filters. All alarms have specific severity and statuses. Mark those you want to see in the widget (unmarked filters display all alarms, regardless of severity/status). By default, widgets stack vertically. Drag the “Alarms” to free dashboard space, resize it to your needs, then click “Save” to apply changes.
② Configure rules
Leverage ThingsBoard’s alarm rules feature to trigger automated alarms when telemetry data reaches a certain value. For this purpose, we should edit the device profile and add a new alarm rule. In this case, my created device is using the “Default” device profile.
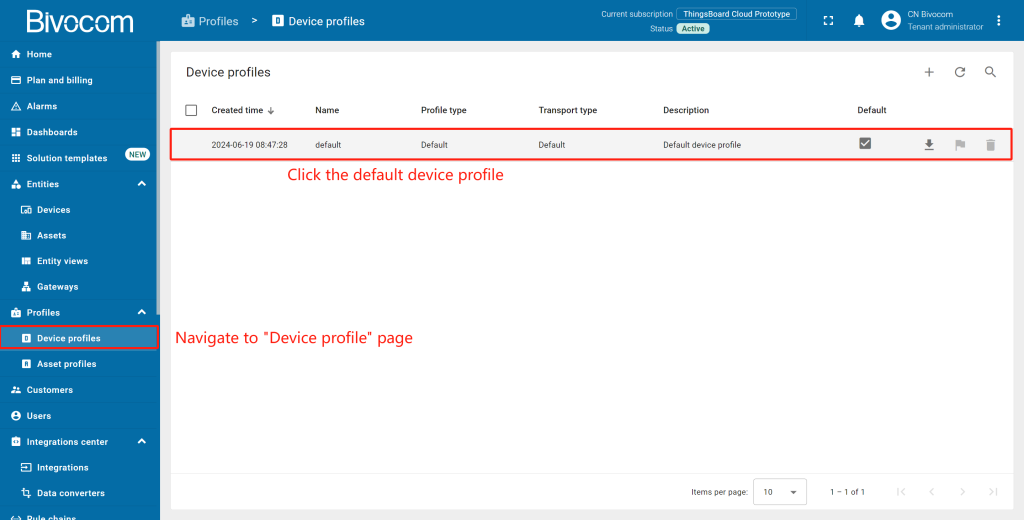
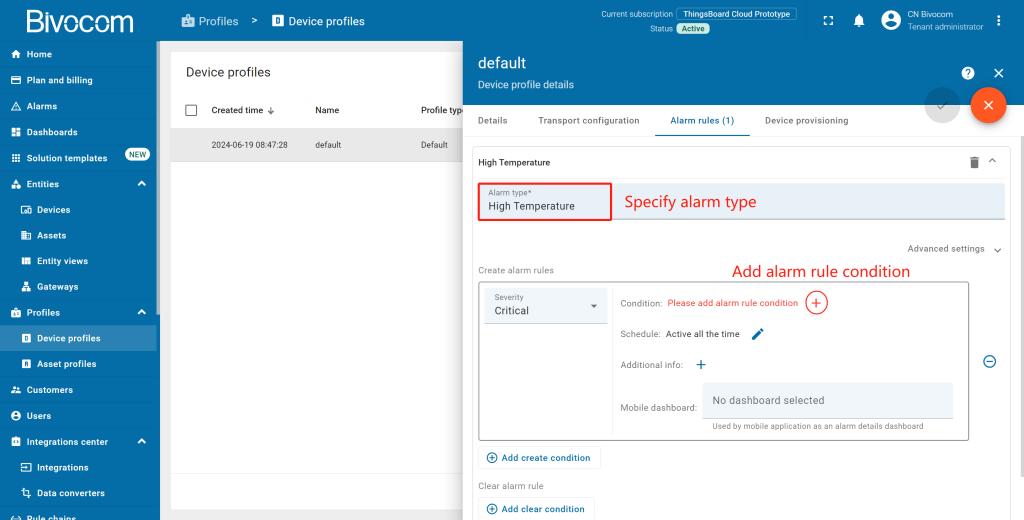
Navigate to “Device profiles” page of the “Profiles” section. Then click on the default device profile row to open its details.
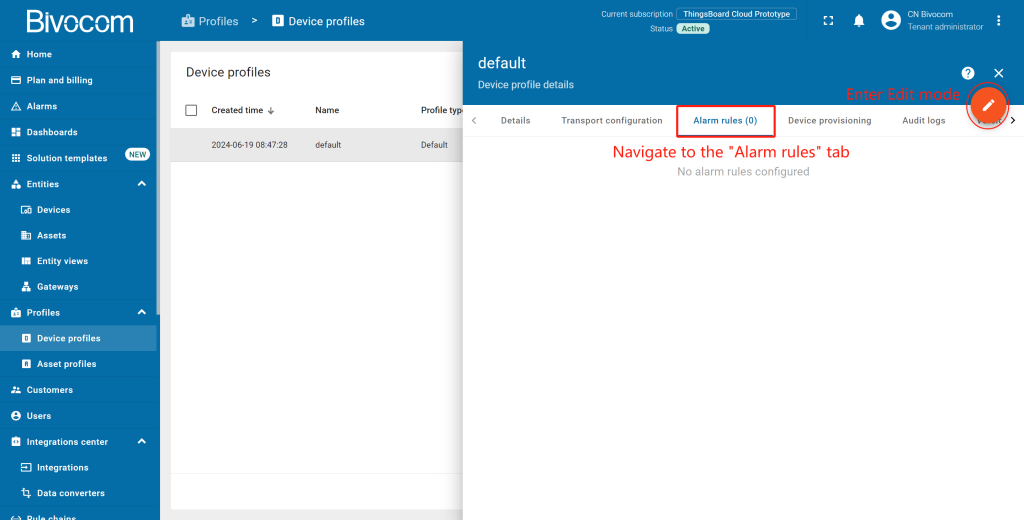
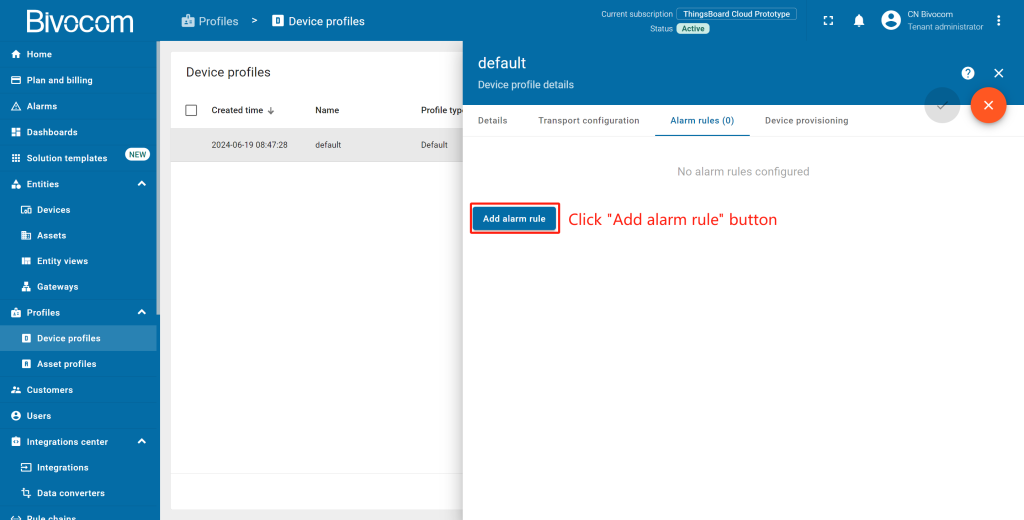
Go to the “Alarm rules” tab → Click the pencil icon to enter edit mode→ Select “Add alarm rule”. Specify alarm type and click the “+” icon to add alarm rule condition.
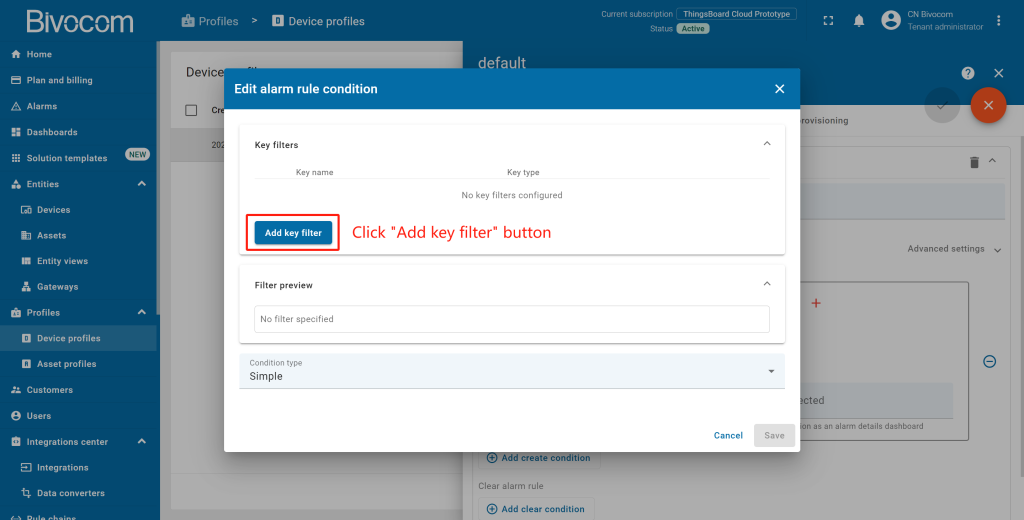
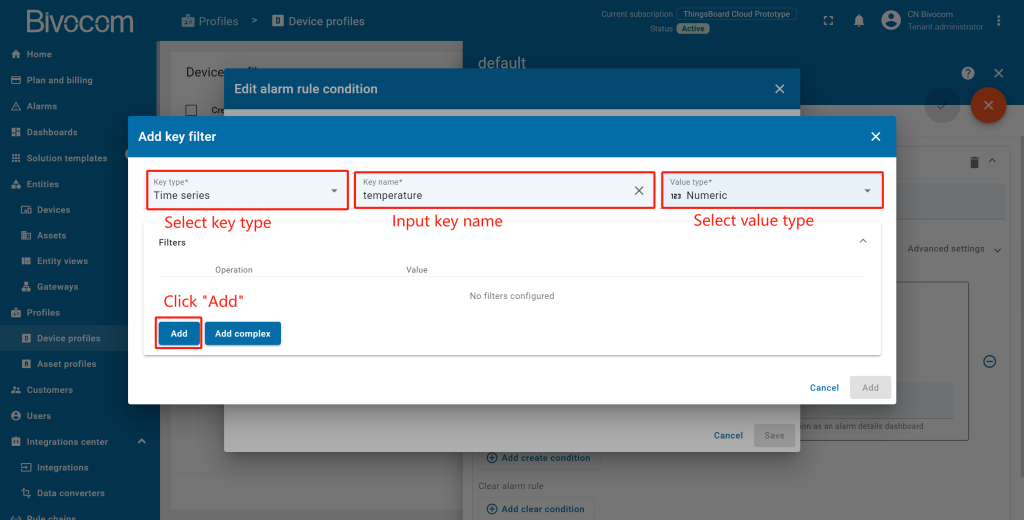
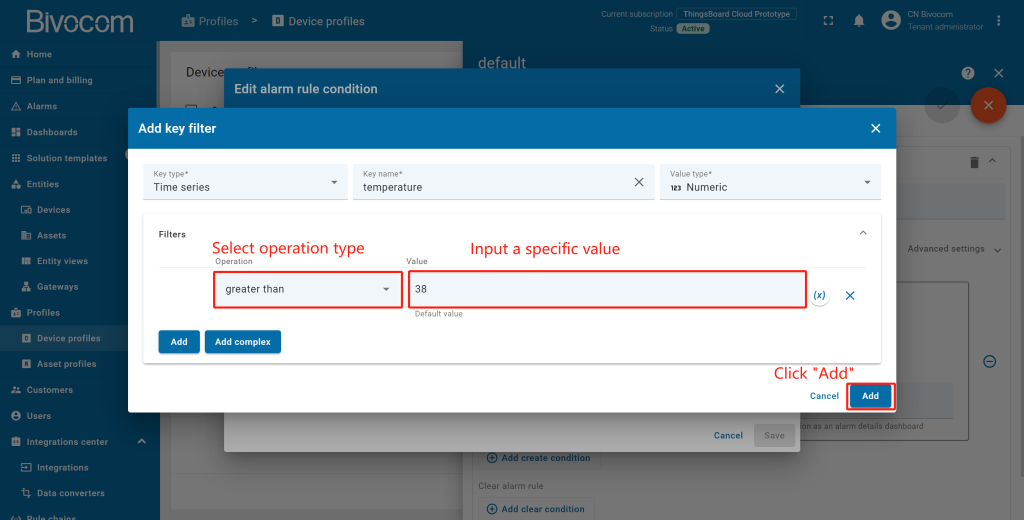
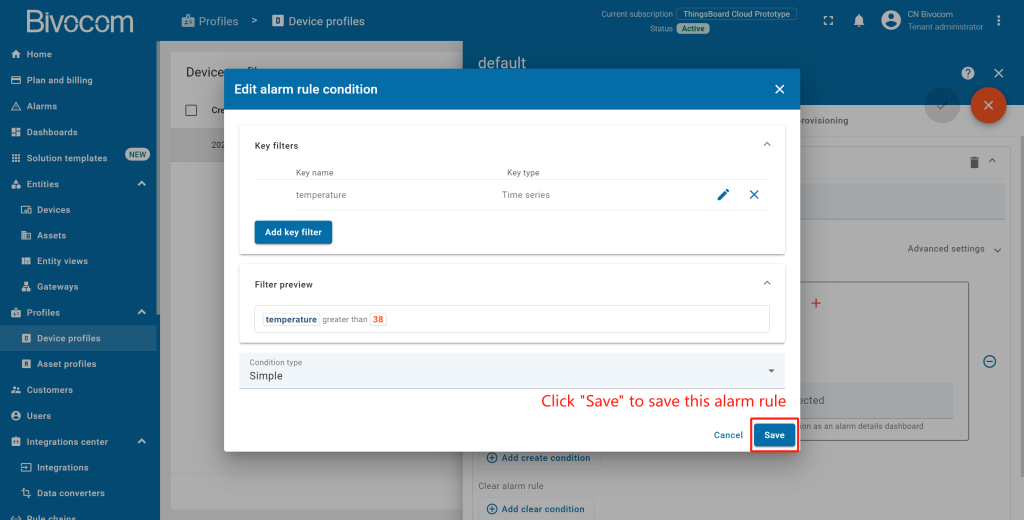
Click the “Add key filter” to specify a condition. Select a key type, enter a key name, and select a value type. Then, click “Add” to add a rule. Select an operation and enter a threshold value. Click “Add” to add this filter. Click “Save” to save this alarm rule condition.
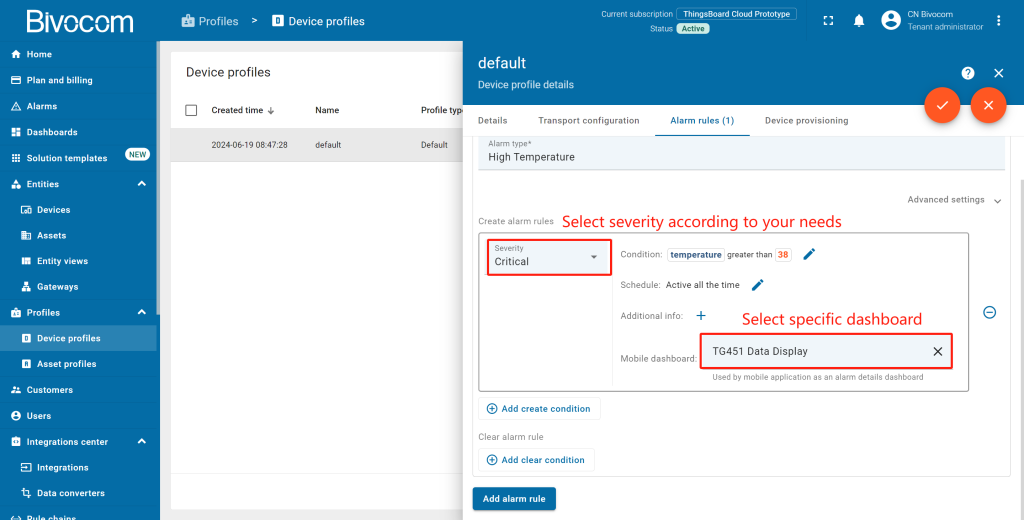
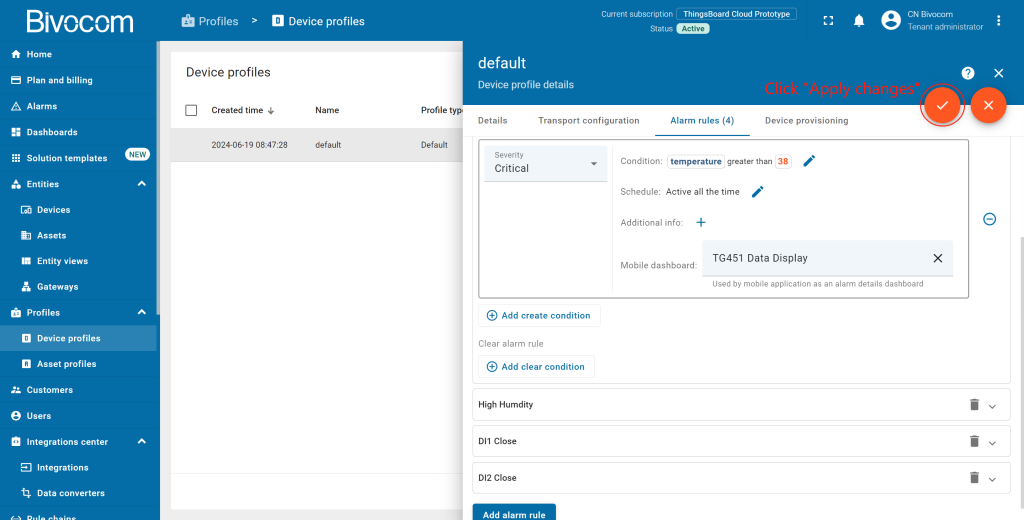
After creating the rule, select a severity type based on your requirements, then assign the rule to your custom Bivocom dashboard. In this case, I add 4 alarm rules for each telemetry data. After, click “Apply changes” to save profile setting.
③ Trigger & Manage Alarms
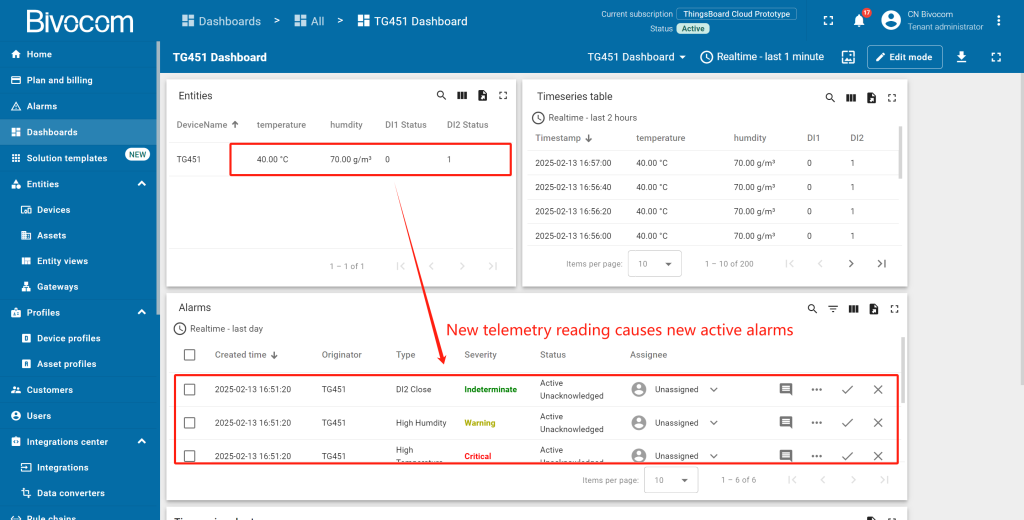
Now, our alarm rule is active—trigger an alarm by sending new telemetry data from your Bivocom device that exceeds your defined threshold value. The new alarm will populate immediately in your dashboard’s Alarms Table. Notice that the new telemetry data causes new activate alarms. You may acknowledge and clear alarms using the “Alarms table” widget.
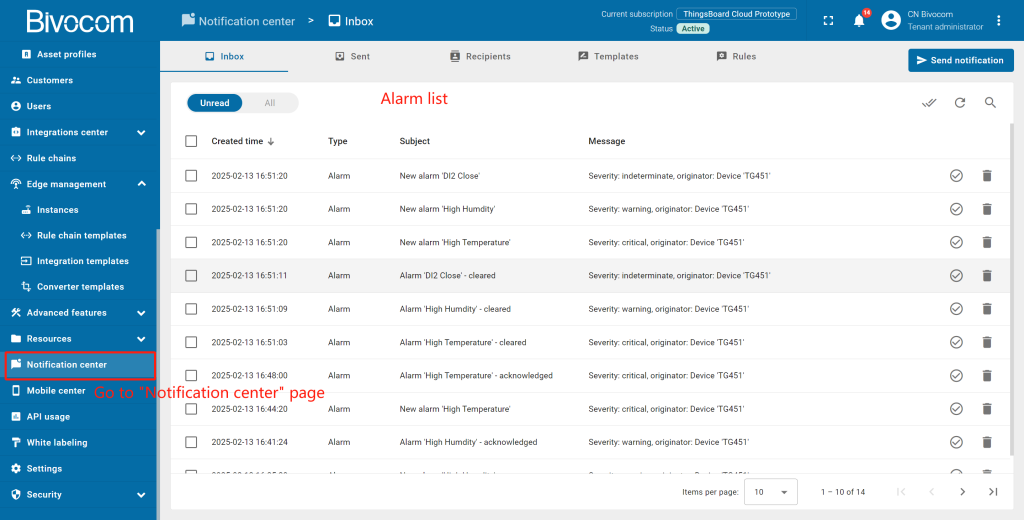
Click “Details” to to view specifics. Notifications will also appear in ThingsBoard’s notification center (bell icon, top-right) for real-time alerts.
The Notification Center supports personalized end-user alerts for device activity, telemetry changes, and other IoT ecosystem events—tailor these to your team’s needs.
Role-Based Access & Dashboard Sharing
ThingsBoard’s access control lets you share your Bivocom-focused dashboard with teams or customers—without compromising sensitive data. There are two core ways to grant access: assign the customer as the device owner (exclusive access) or share the dashboard group (multi-customer access). Below is a streamlined guide to both.
1. Create a customer
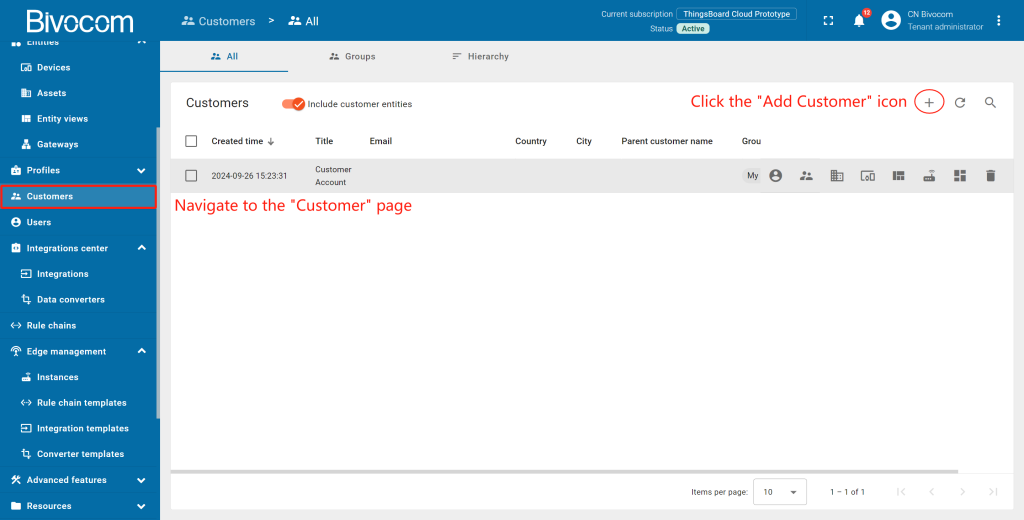
Navigate to “Customers” > “All” → Click “+” to add a new customer.
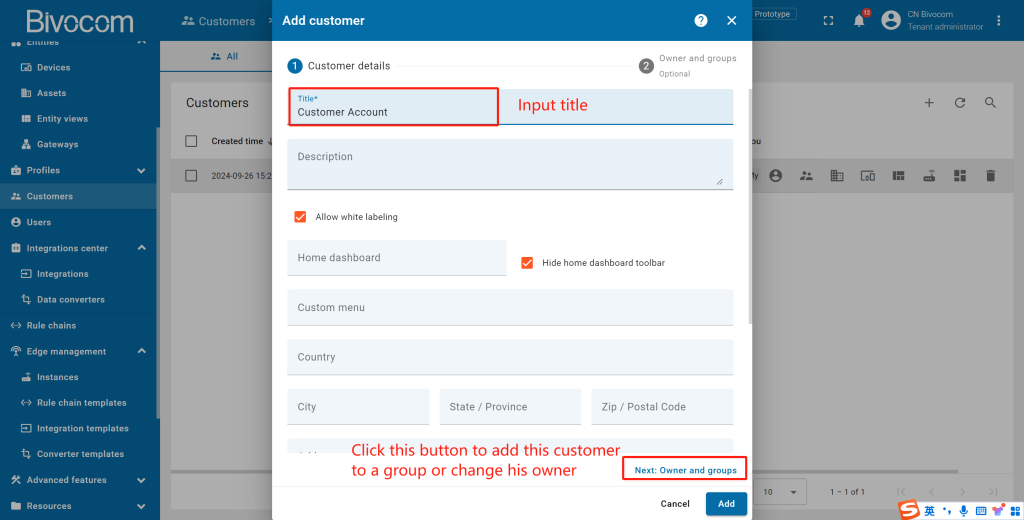
Input the customer title. Additionally, you can input personal details for the customer and assign a home dashboard. To finalize the creation, you can click the “Add” button. In this case, the new customer will be created and located in the “All” customers folder. Let`s create a separate group for our customer. To do this, click on “Next: Owner and groups”.
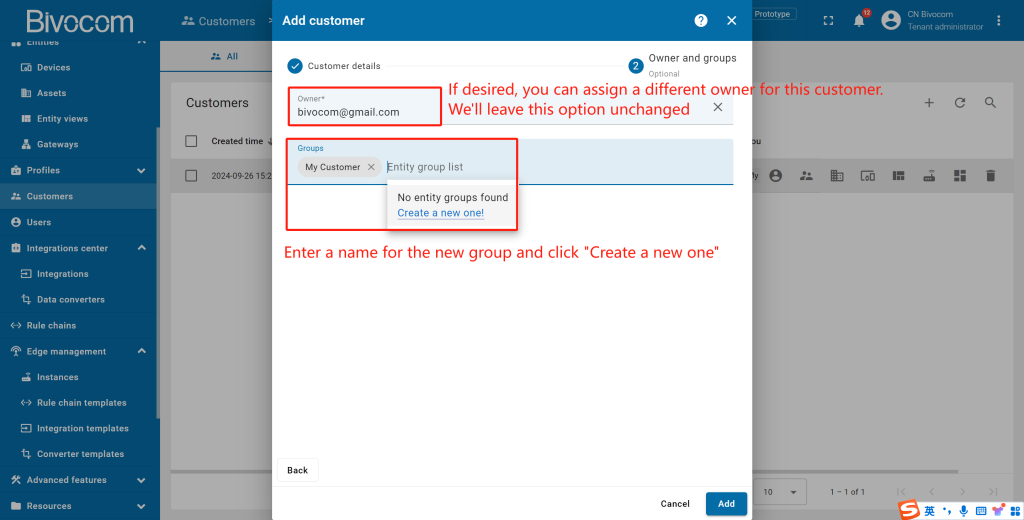
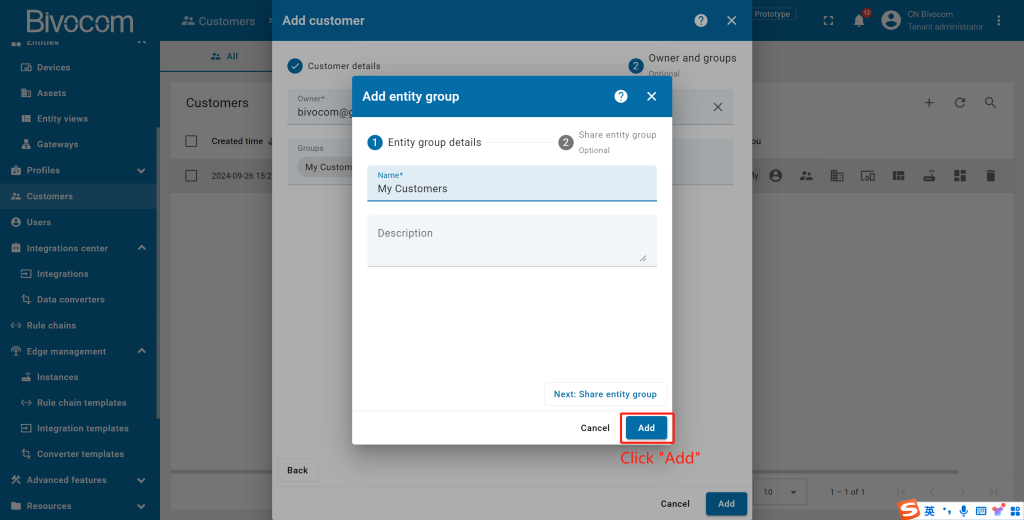
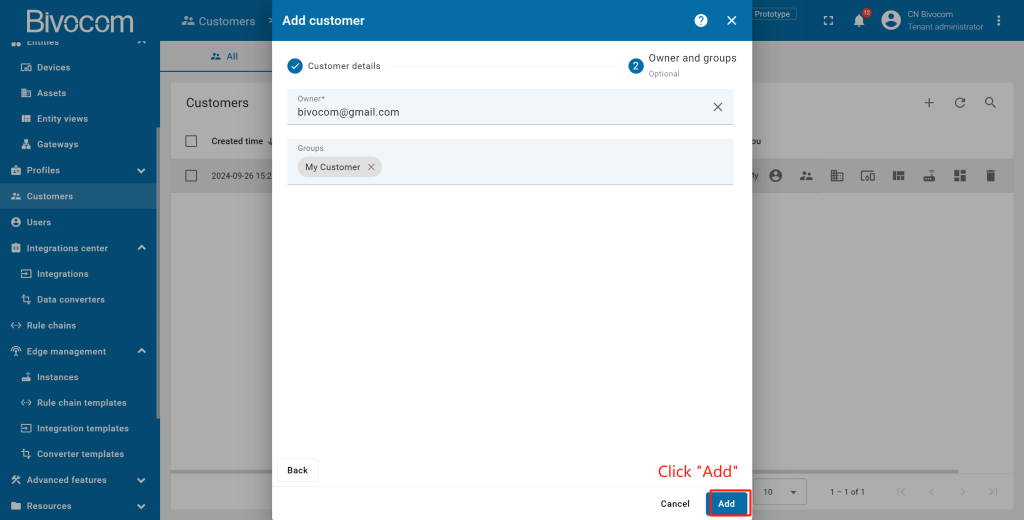
If desired, you can assign a different owner for this customer. We will leave this option unchanged. Enter a name for the new group and click “Create a new one!”. Click “Add” to create a new customers group.
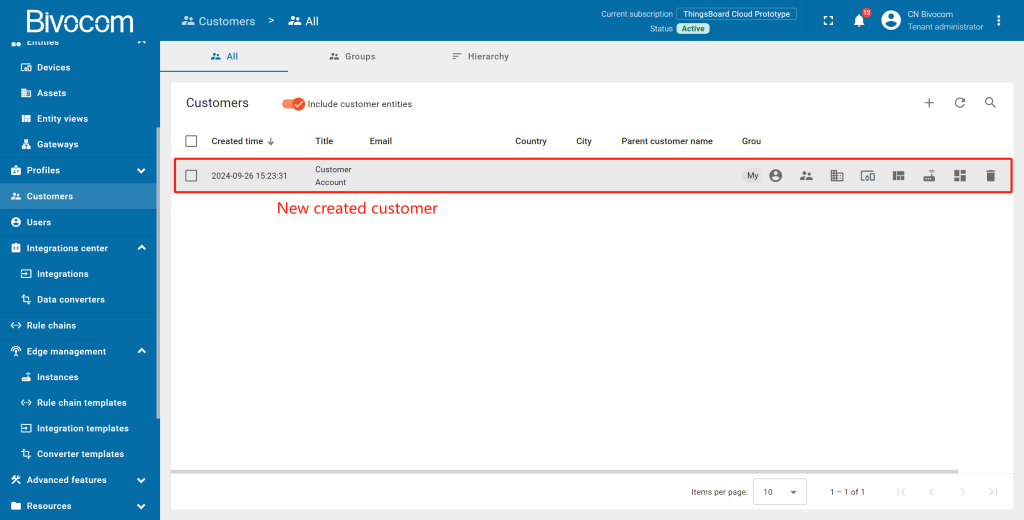
Now, click “Add” to create a new customer. The customer has been created and is located in the “My Customers” group.
2. Change owner of the device
Let’s assign the Customer as the owner of the device. We will also create a group of devices and add our device to this group.
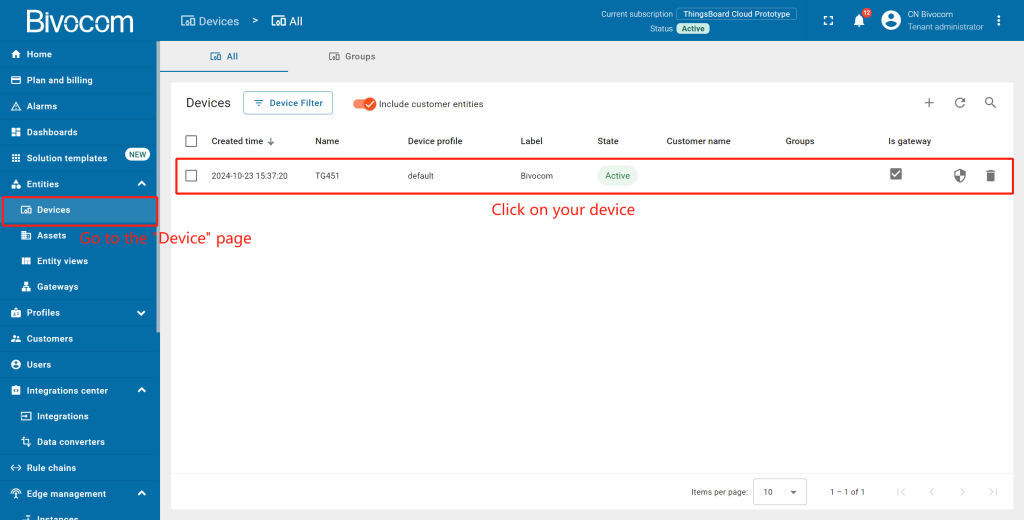
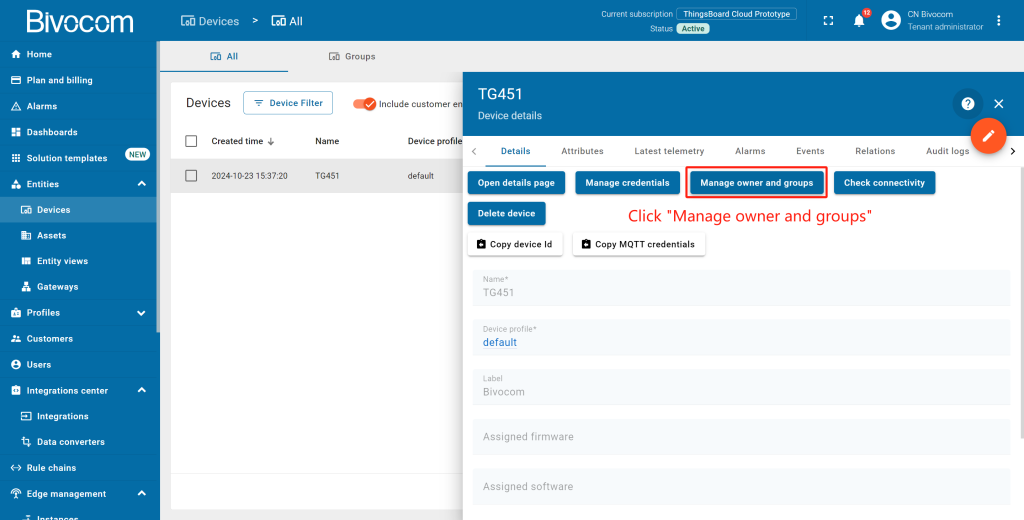
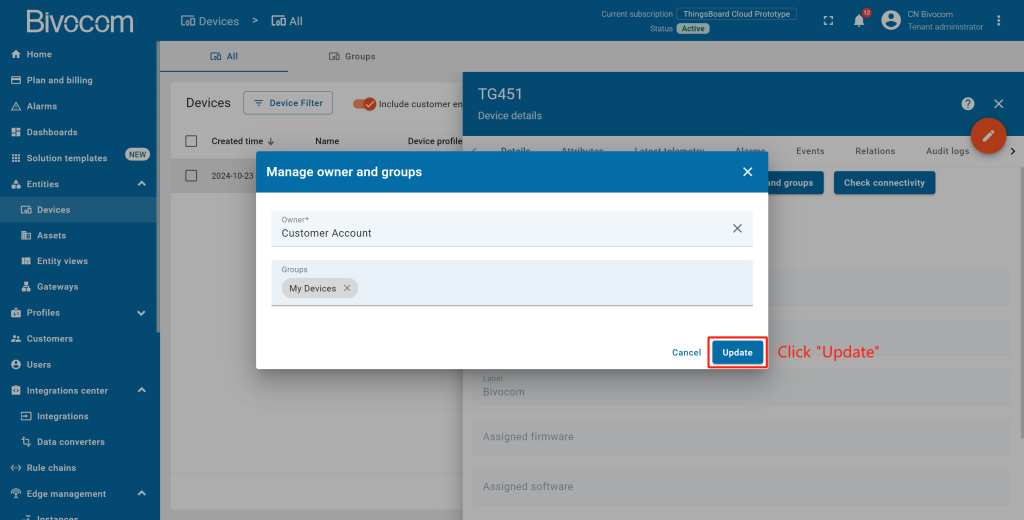
Go to “Devices” → Open your Bivocom device details → Click “Manage owner and groups”.
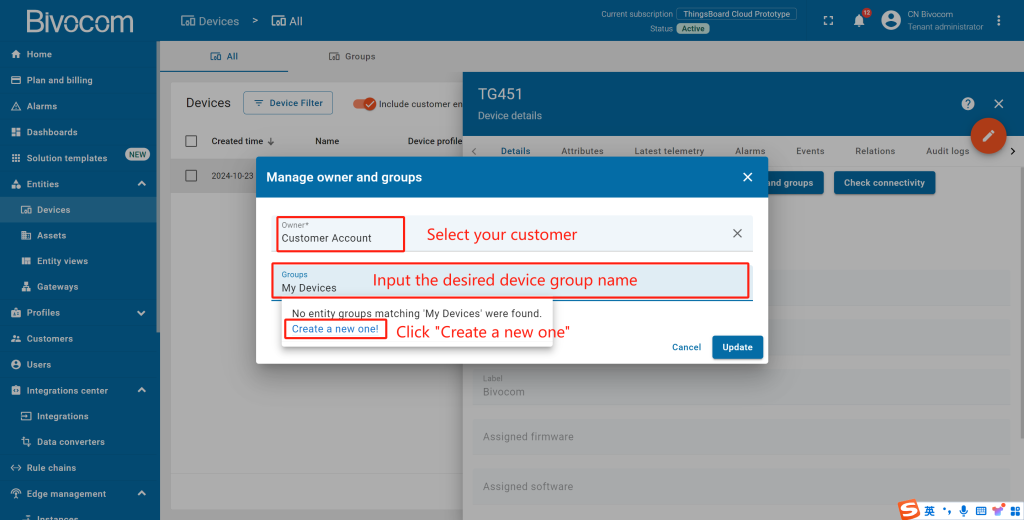
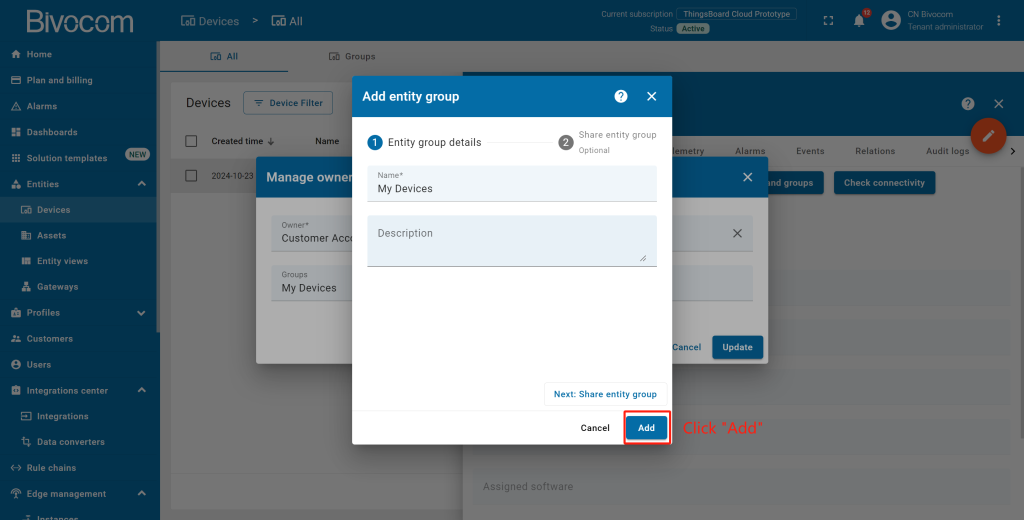
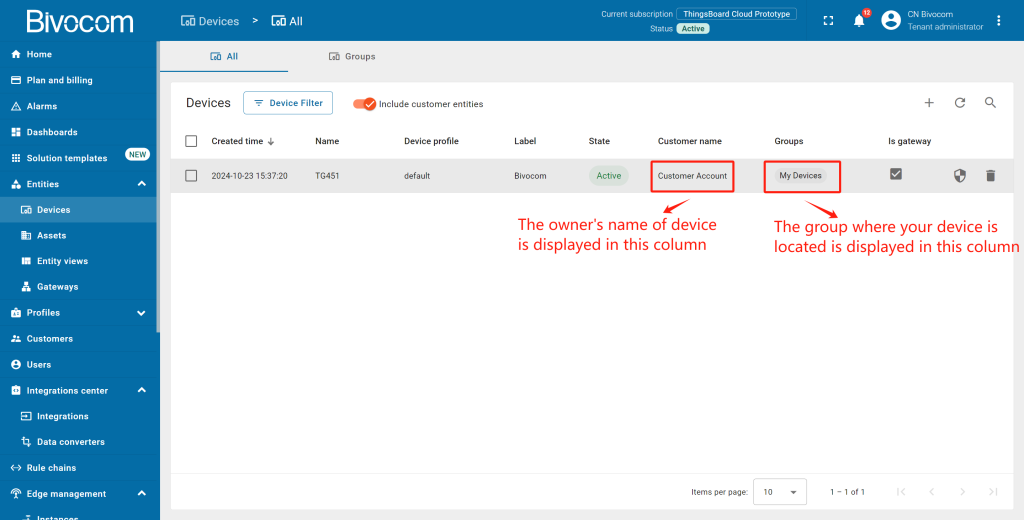
In the “Owner” line, start typing the customer name and then select the customer. In the “Groups” line, input the desired device group name. Then, click “Create a new one!”. In the next window, click “Add” to create a device group. Click “Update” to add to the group and change the owner of your device. You can always change the owner back to the tenant.
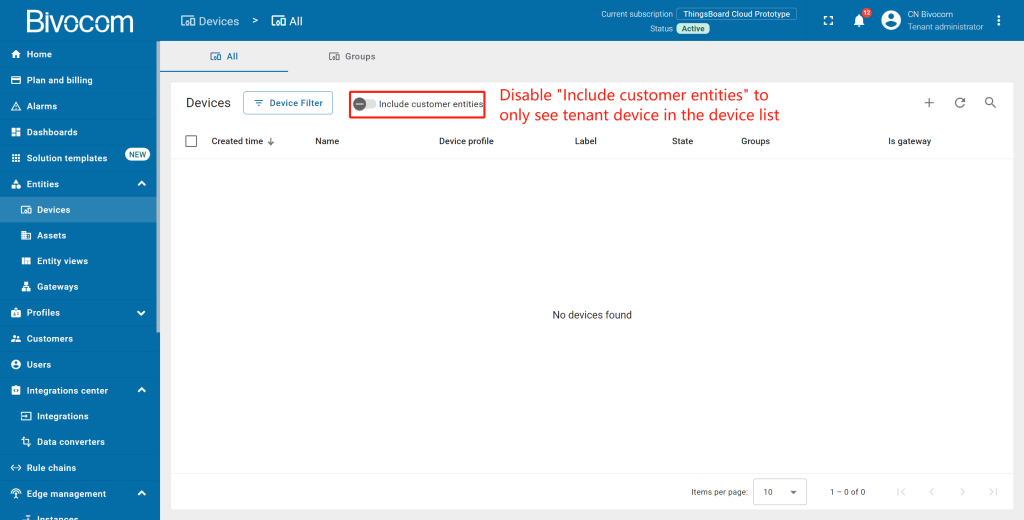
By default, the general device list displays both tenant devices and devices of your customers. Disable “Include customer entities” to only see tenant devices in the device list. Your device list should be empty after disabled.
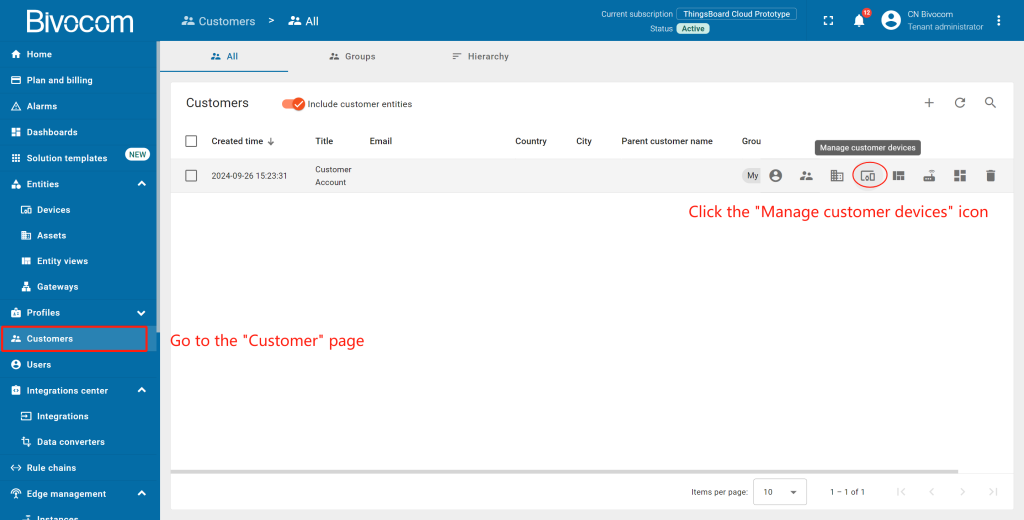
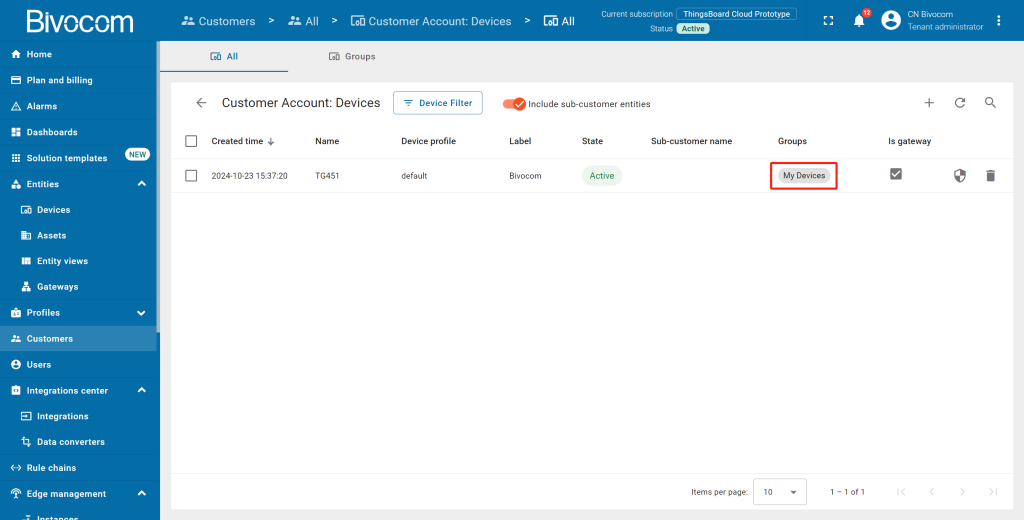
Verify the assignment: Navigate to “Customers” > [Your Customer] > “Manage customer devices”—your Bivocom device will appear in the “My Devices”.
3. Share the dashboard
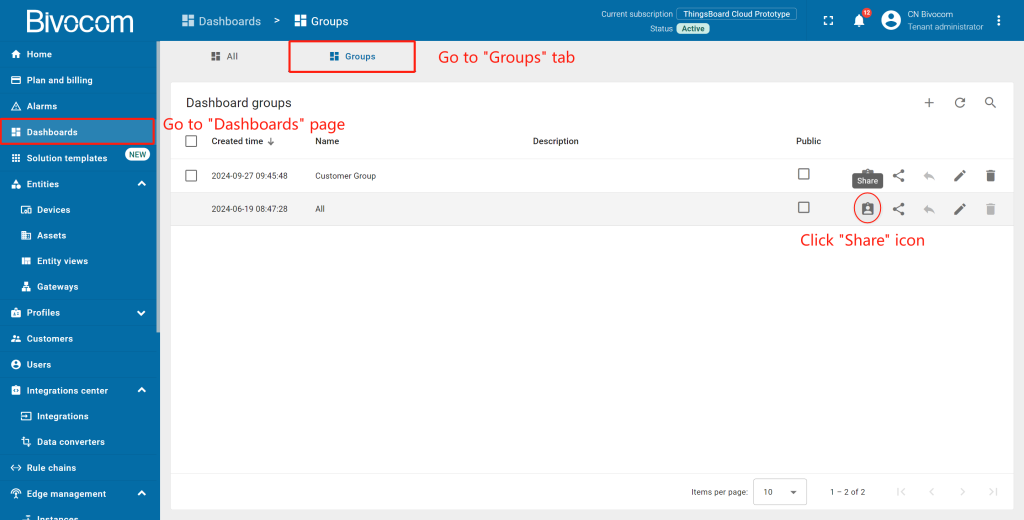
Dashboards cannot be shared individually—only via a dashboard group. We use the default “All” group for this setup (for production, create a dedicated group for shared dashboards).
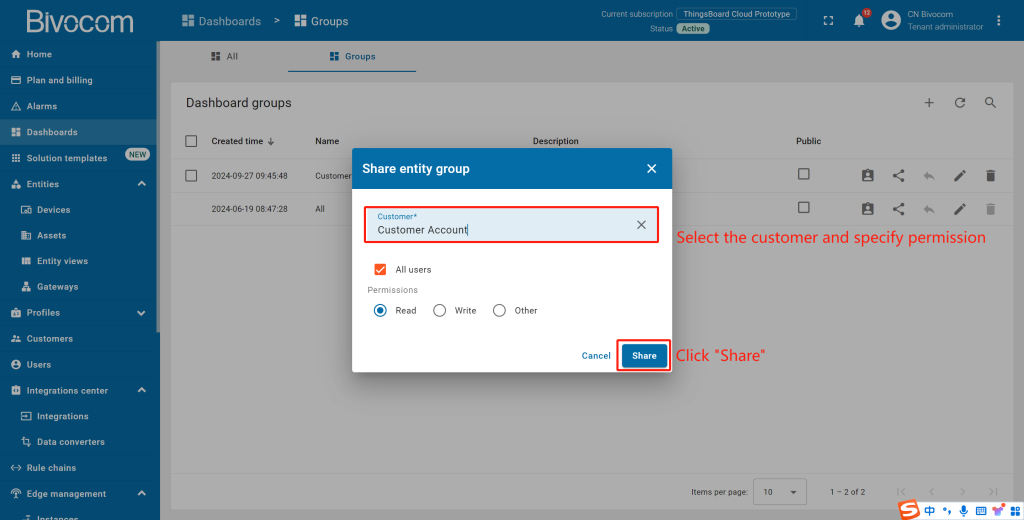
Open “Dashboard” → Go to”Groups” → Click the “Share” icon for the “All” group → Select your customer and specify the permission level (In our case, choose “Read”) → Click “Share”.
4. Create a customer user
Finally, let’s create a user that will belong to the customer and will have read-only access to the dashboard and the device itself. You may optionally configure the dashboard to appear just after the user login to the platform web UI.
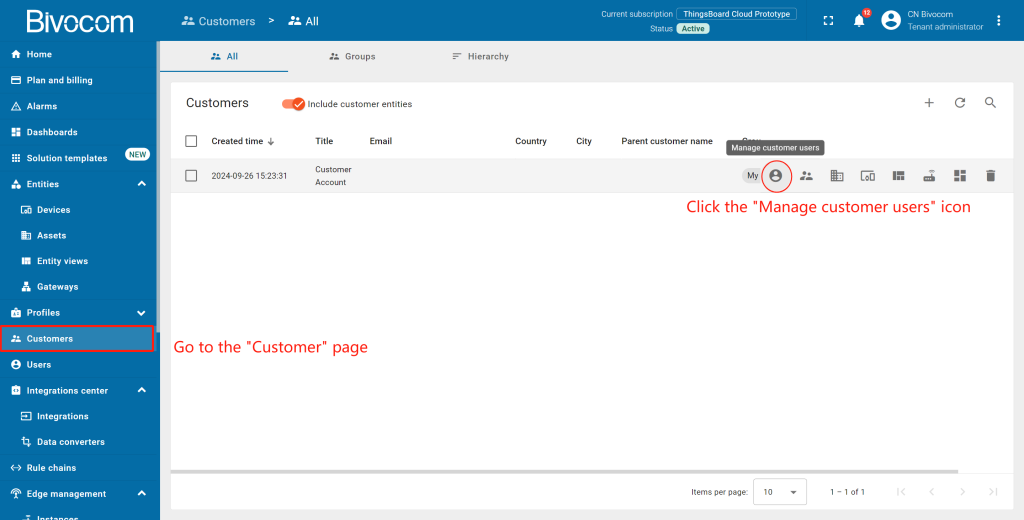
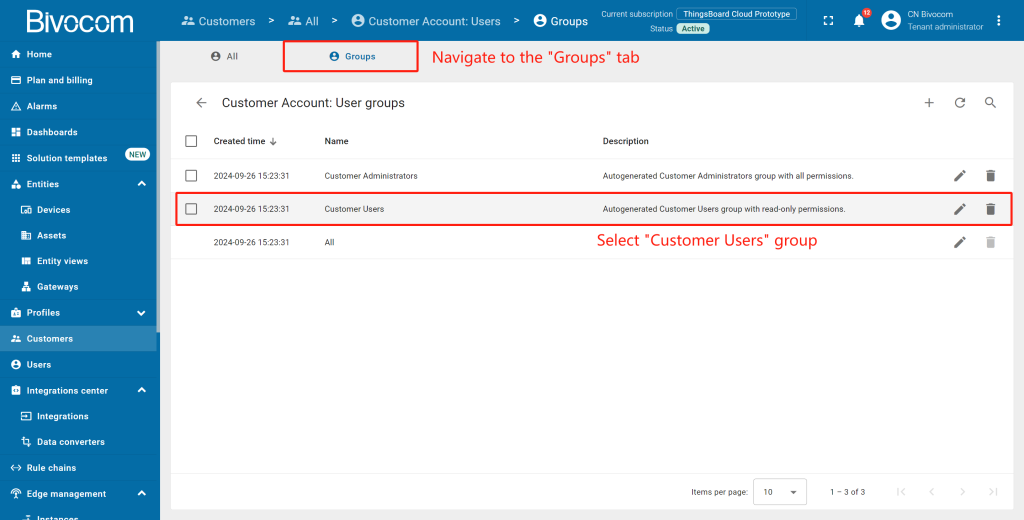
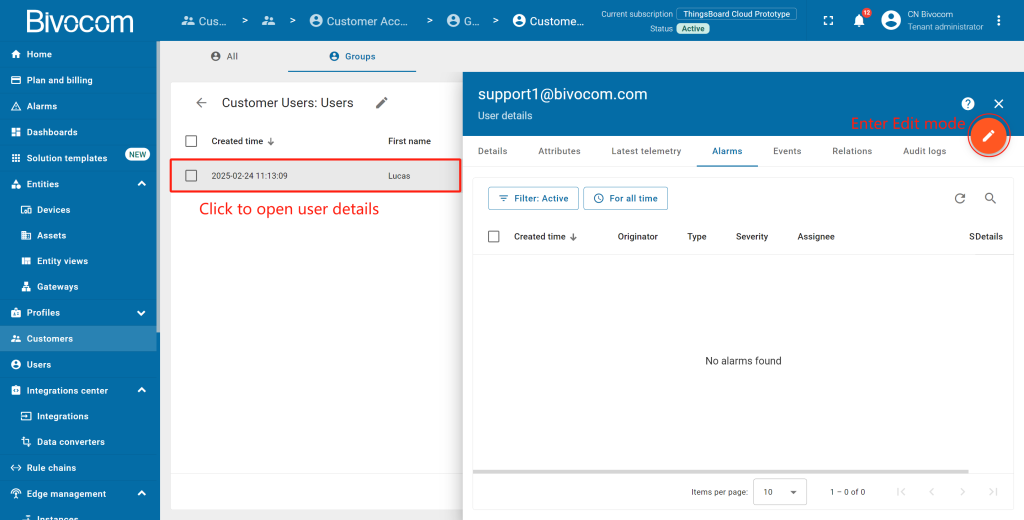
Navigate to “Customers” → [Your Customer] → Click “Manage customer users” → Go to the “Groups” → Select “Customer Users” group.
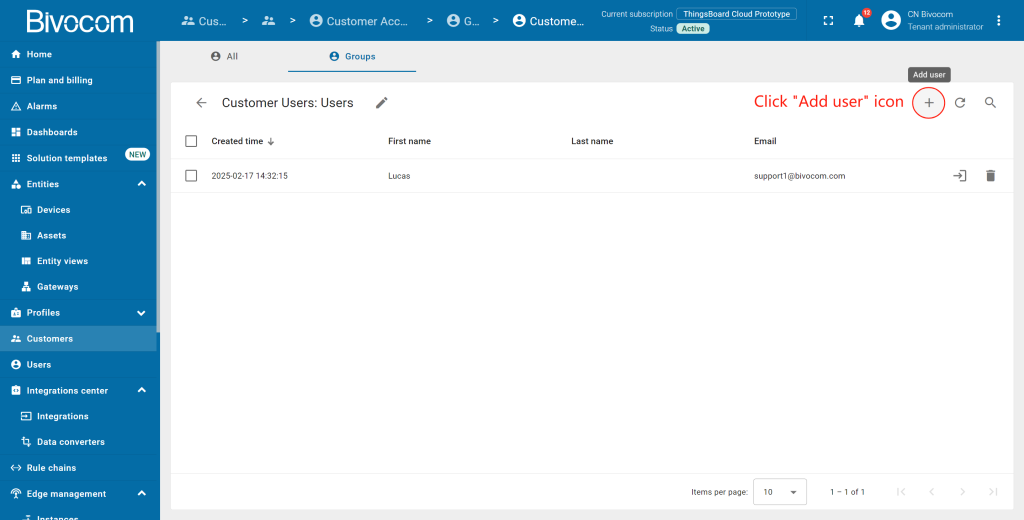
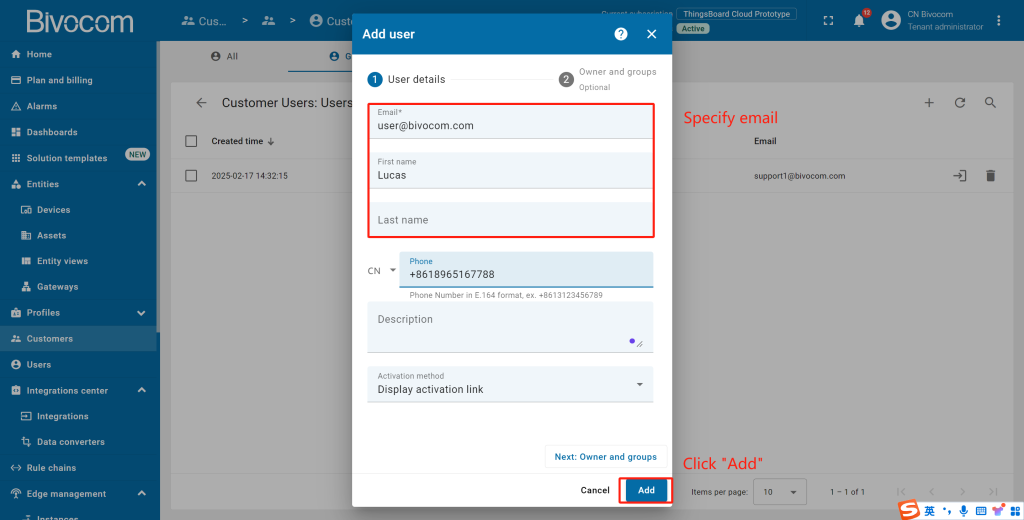
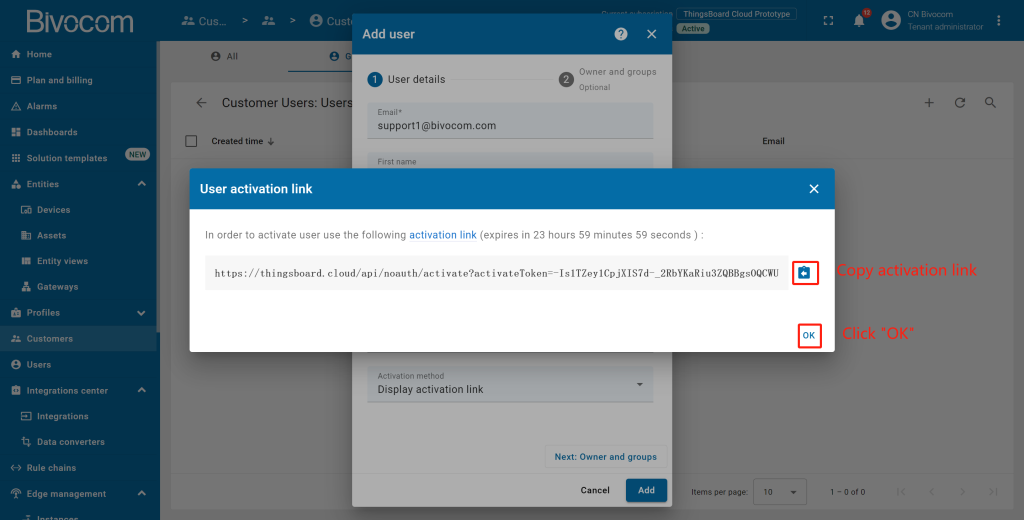
Click “plus” icon in the top right corner. Enter the user’s email. Additionally, specify the first and last name, then click “Add”. Copy the activation link and save it to a safe place. Then click “OK”.
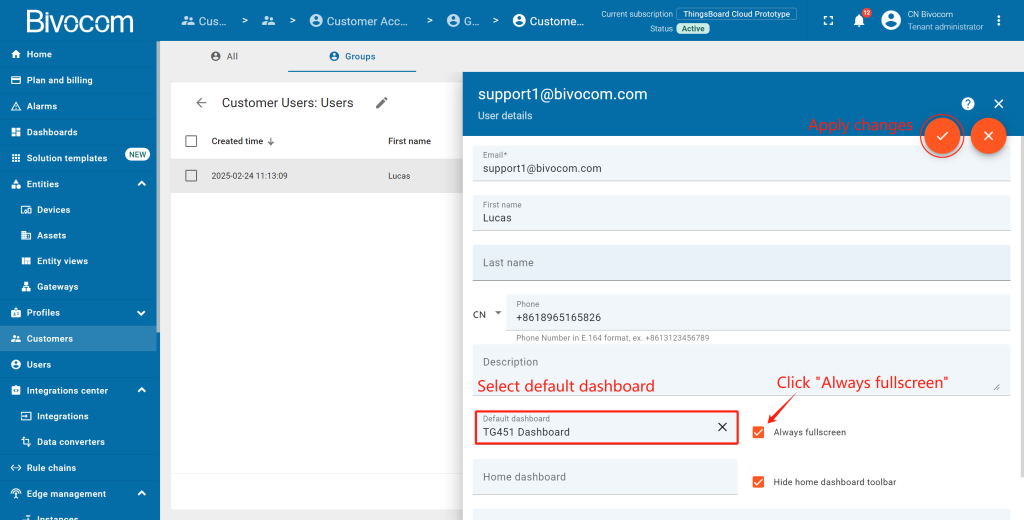
Click on the created user to open details. Click “pencil” icon to enter edit mode. Select a specific default dashboard and check “Always fullscreen”. Apply changes.
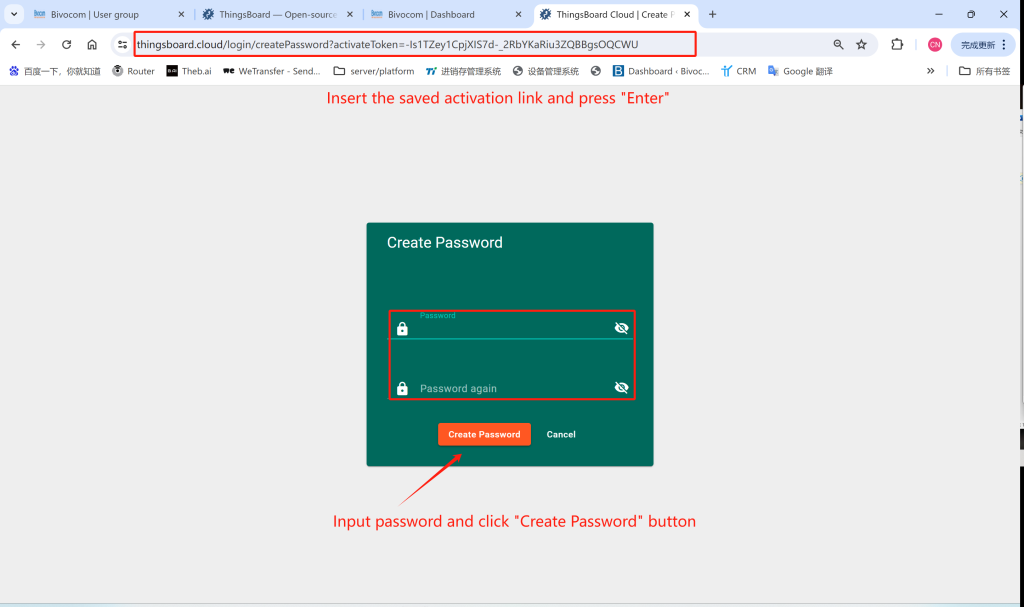
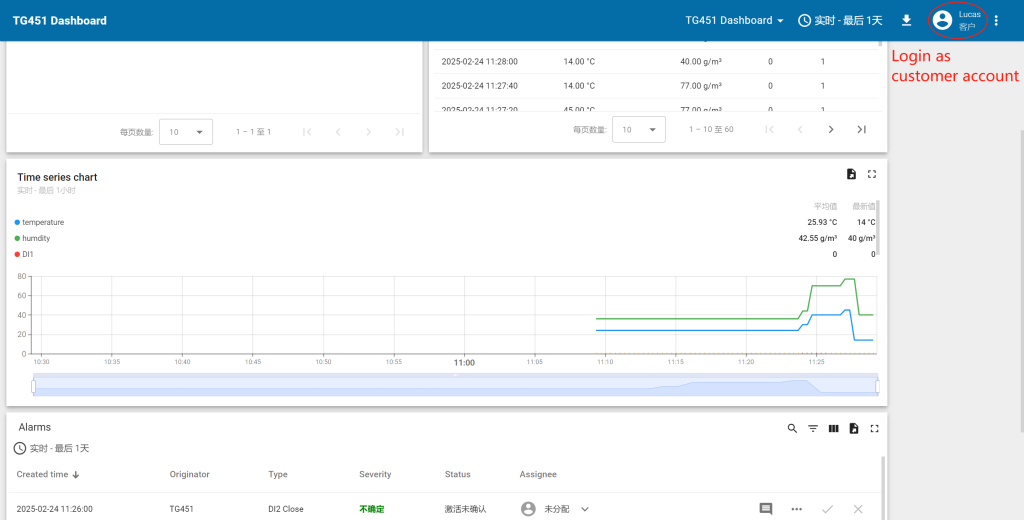
Activate the customer user: Paste the activation link into a new browser tab → Set a password → Click “Create Password” (the user is automatically logged in). You have logged in as a Customer User. You may browse the data and acknowledge/clear alarms.
Professional Support & Services
Elevate your Bivocom ThingsBoard Dashboard’s impact with dedicated support designed to turn your advanced customization into actionable, scalable results. Our tailored framework aligns with your industry workflows, resolves technical hurdles, and maximizes ROI—via three focused pillars:
- Customization Expertise: Guidance on widget refinement, alarm rule optimization, and role-based access setup to align your dashboard with operational needs (e.g., industrial monitoring, client reporting).
- Industry-Aligned Solutions: Tailored adaptations for sector-specific use cases (energy, cold chain, smart cities) and seamless integration with Bivocom’s multi-protocol hardware.
- Accelerated Deployment Resources: Curated templates, troubleshooting guides, and best practices to streamline advanced setup and scale without rework.
Contact our solutions team at [email protected] for personalized support. With Bivocom, you gain more than a customized dashboard—you secure a partner to drive data-driven decisions across your IoT ecosystem.




Comment