Step-by-Step Configuration
Following our recent announcement of the strategic partnership between Bivocom x ThingsBoard, many users are eager to turn this powerful collaboration into tangible results. This tutorial will walk you through achieving a complete Bivocom ThingsBoard Platform Integration. You will learn how to provision your gateway, configure data collection, and build actionable dashboards, transforming raw sensor data into operational insights.
Prerequisites You Need
- An active ThingsBoard account (Cloud, Professional, or your own instance).
- A Bivocom gateway/router (like the TG451) within your network.
- Administrator access to the gateway’s WEBUI.
- A sensor, meter, or Modbus simulator connected to your gateway for data collection.
Step 1: Provision a Gateway Device in ThingsBoard
First, you must create a secure digital identity for your physical gateway in ThingsBoard. This links your physical hardware to the platform.
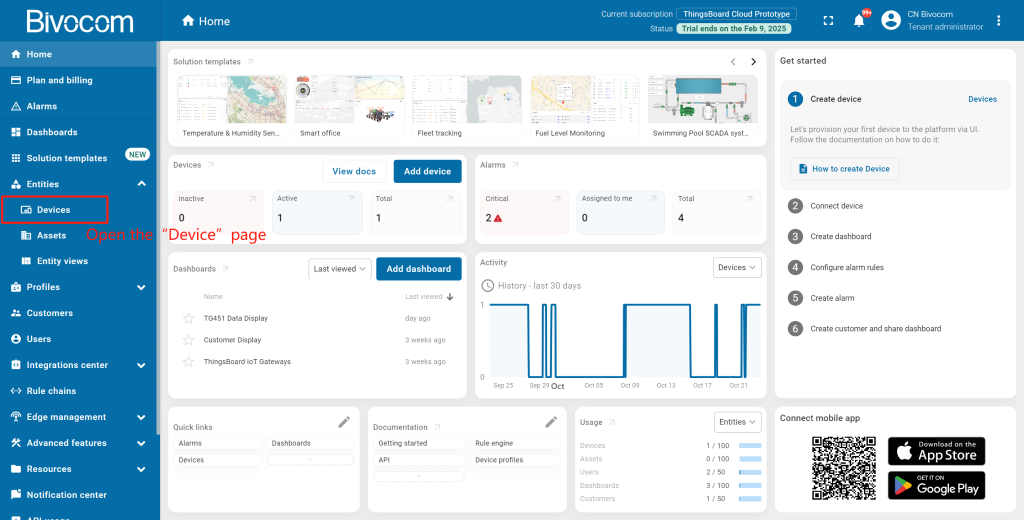
①Navigate to Entities > Devices in your ThingsBoard account.
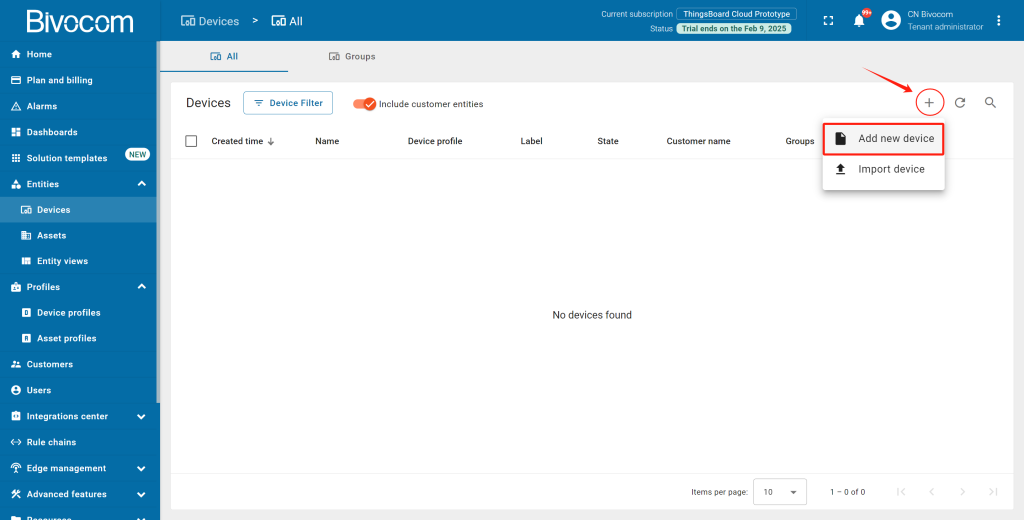
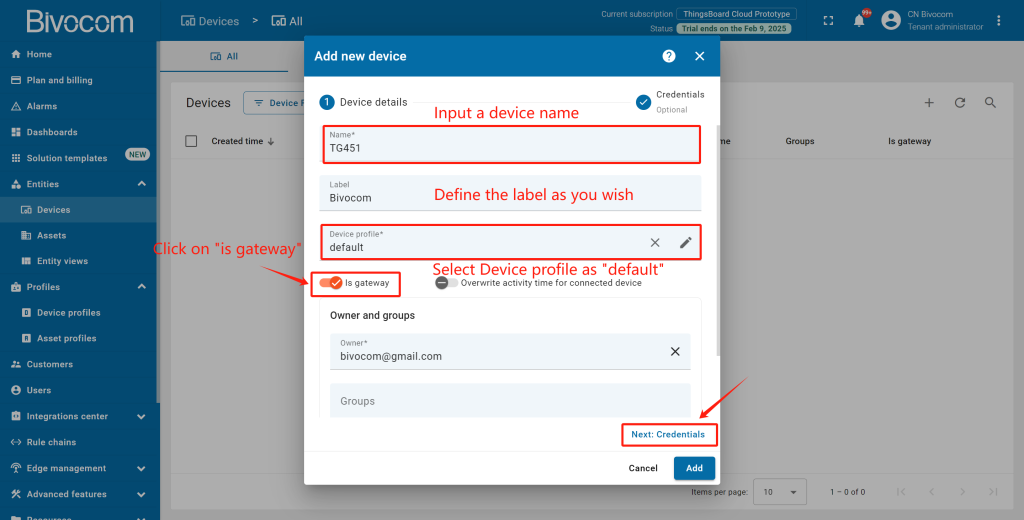
② Create a New Gateway Device: Click the “+” and select “Add new device”. Give your device a clear name, leave the label optional, and select “Device profile” as default. Check the box labeled “is gateway”. This enables essential gateway features. Then, click “Next: Credentials”.
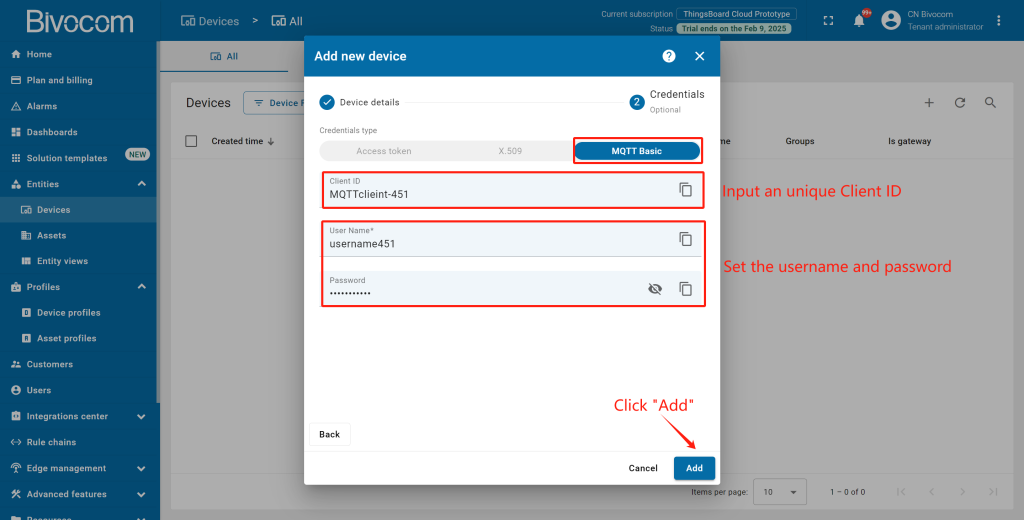
③ In this case, the gateway is communicated to ThingsBoard via MQTT protocol. So we have to configure the credentials of MQTT broker.
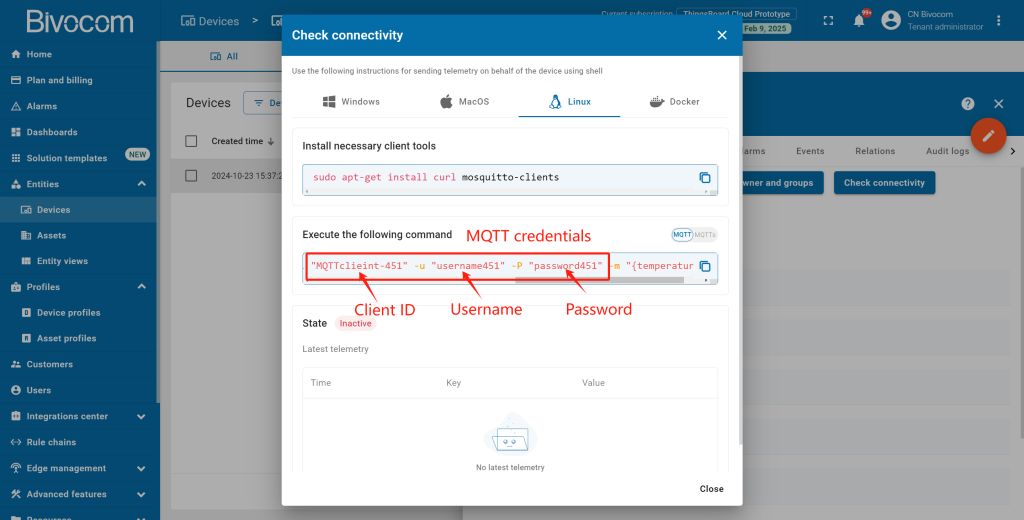
Configure Credentials: Select “MQTT Basic”, input a unique Client ID, username, and password. Record these three details securely—you will need them shortly to configure your Bivocom gateway. Then click “Add”.
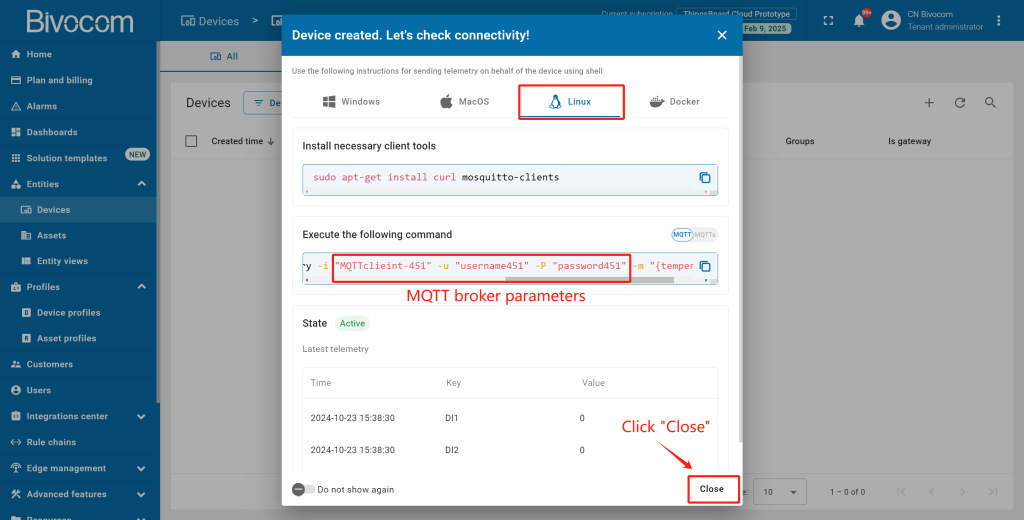
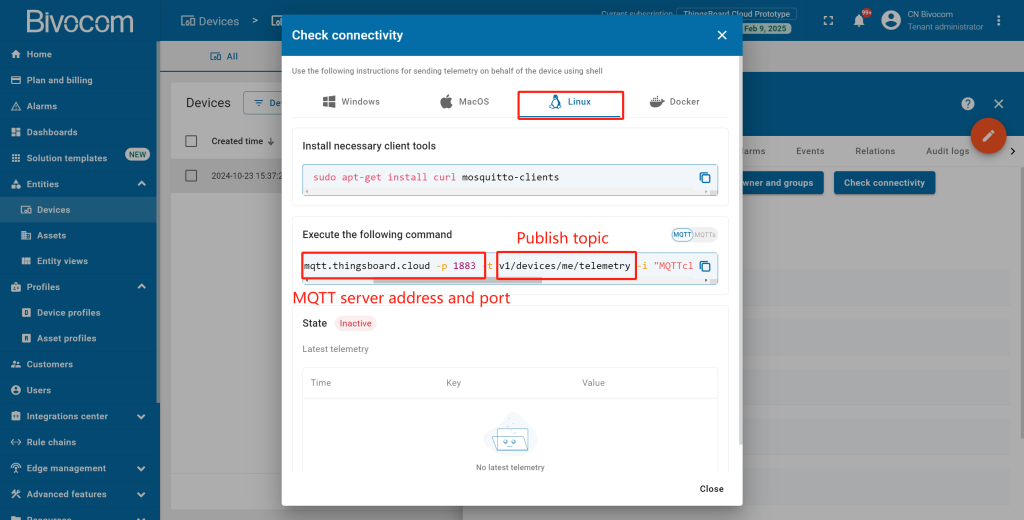
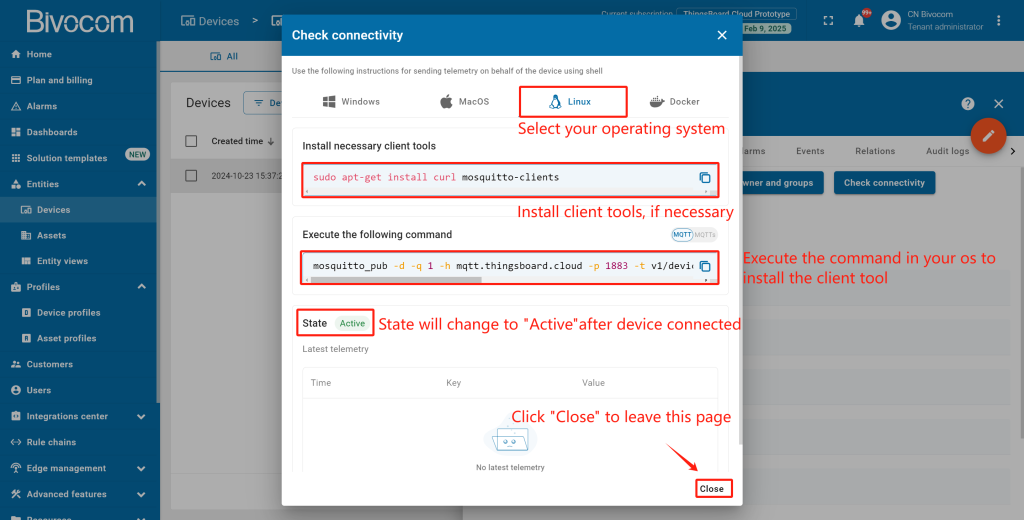
④ Verify Creation: The device is now added. A window will pop up where you can check the device’s connection to ThingsBoard. Since Bivocom gateways run OpenWrt (a Linux-based system), select “Linux” from the OS dropdown. You can review the MQTT broker parameters here. Then click “Close”.
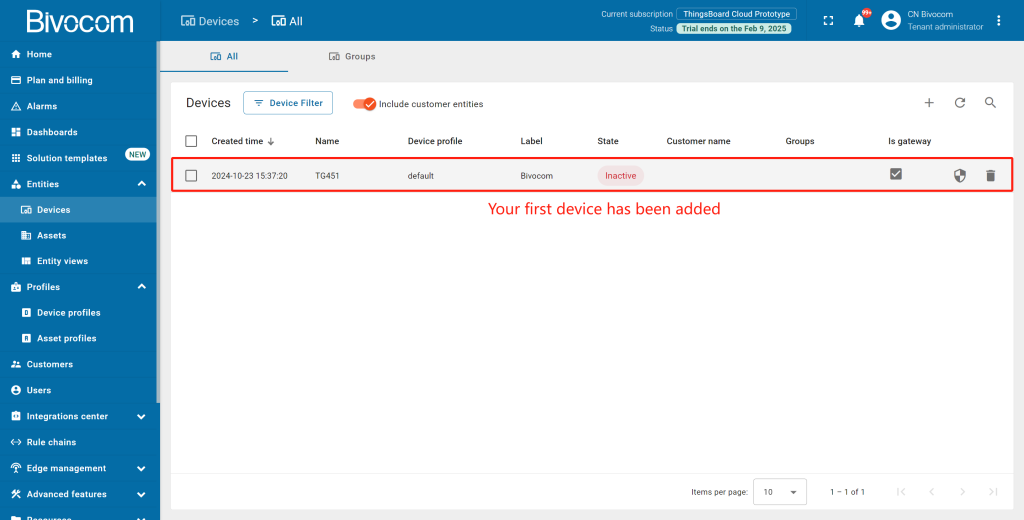
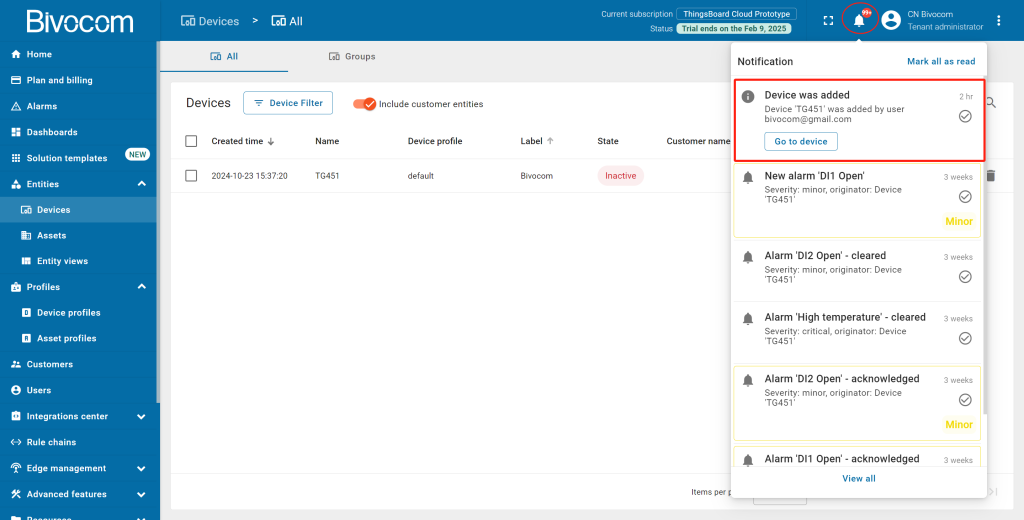
Your gateway will now appear in the Devices list with an “Inactive” status (we’ll activate it later). New devices sort to the top of the list by creation time, and you’ll get a notification via the bell icon in the top-right corner.
Step 2: Configure Bivocom Gateway
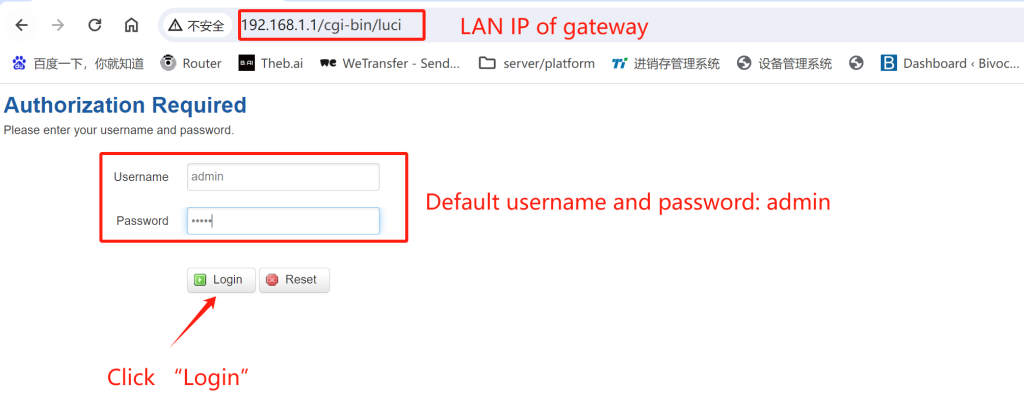
Now, let’s configure your Bivocom hardware to collect data and establish a connection to ThingsBoard. First, login to the WEBUI of your gateway via LAN IP. Default username and password are both “admin”. Then click “Login” to access.
1. Foundational Data Collection Setup
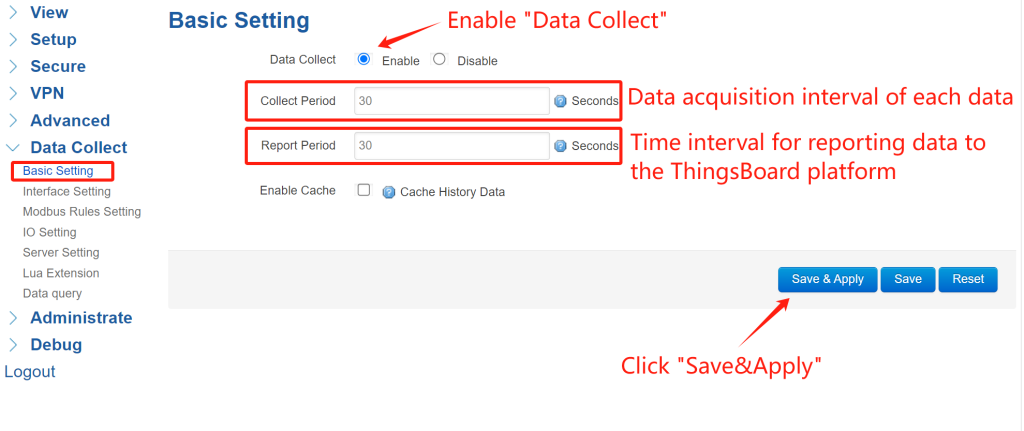
① Basic Settings: Navigate to Data Collect > Basic Setting.Toggle “Data Collect” to enable, then set your desired collect and report intervals. Then click “Save&Apply”.
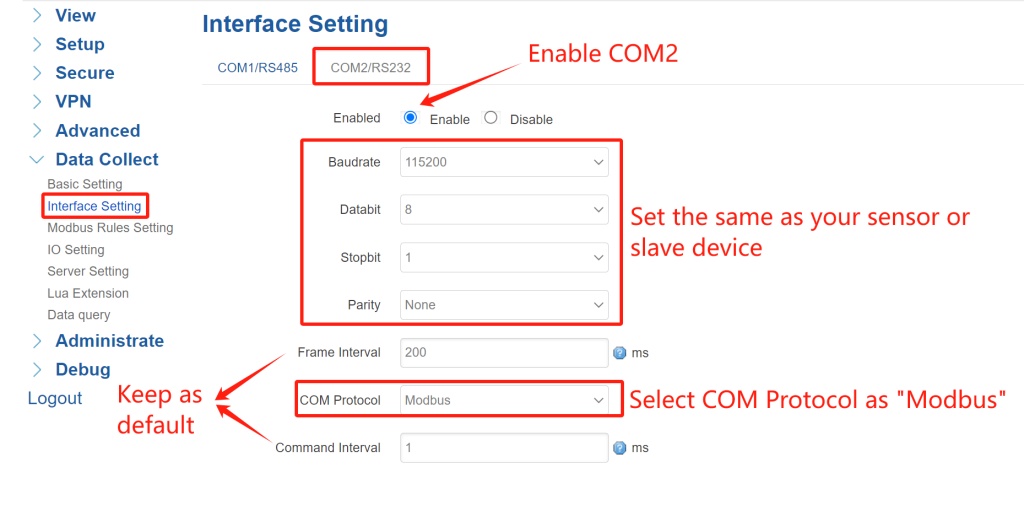
② Interface Settings: Navigate to Data Collect > Interface Setting. Select the COM port connected to your device (this case, I use COM2-RS232 to connect gateway with slave), enable the port, and match the baudrate, data bits, and parity with your sensor. Enable it and set the protocol—for example, choose “Modbus” for Modbus RTU devices. Keep “Frame Interval” and “Command Interval” as default. After configured, click “Save&Apply”.
2. Modbus Rules Setting
In this case, the gateway is connected with salve device via RS232, so the communication protocol is Modbus RTU. We need to configure the Modbus rule according to Modbus device.
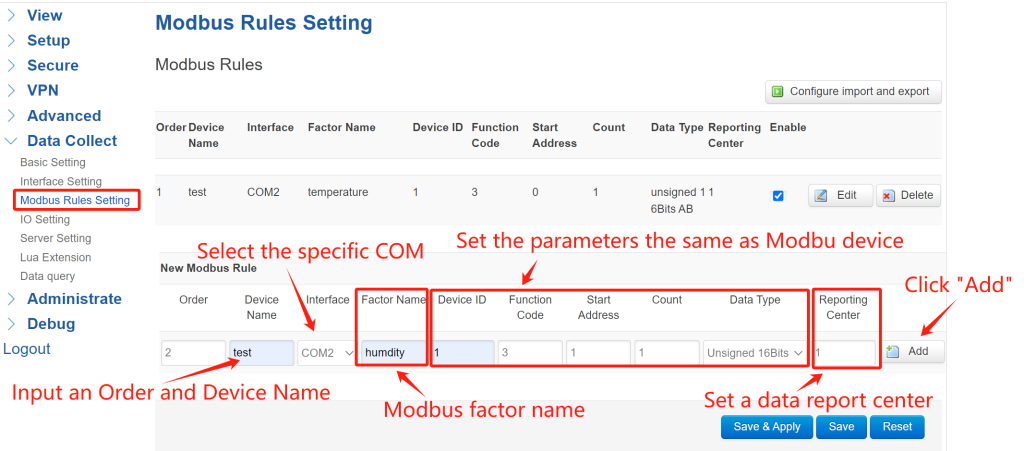
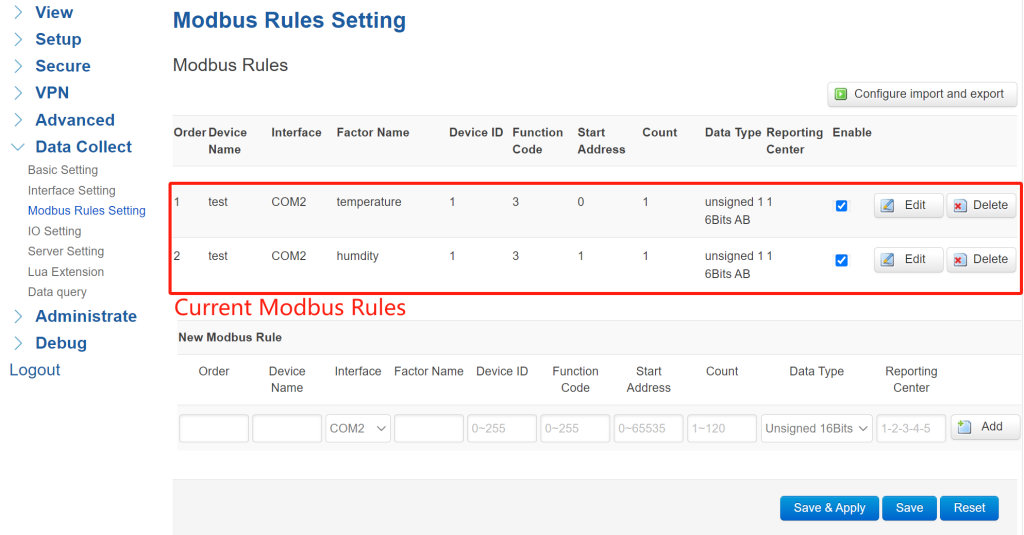
① Define Protocol Rules: Navigate to Data Collect > Modbus Rules Setting and click “Add” to create a new rule.
Set the “Order” and “Device Name” as you wish. “Interface” select “COM2” . Define a Modbus factor name. Set the Modbus parameters the same as your sensor or slave device. Select a data reporting center according to your “Server Setting”. After configured all parameters, click “Add”—rules will list in creation order.
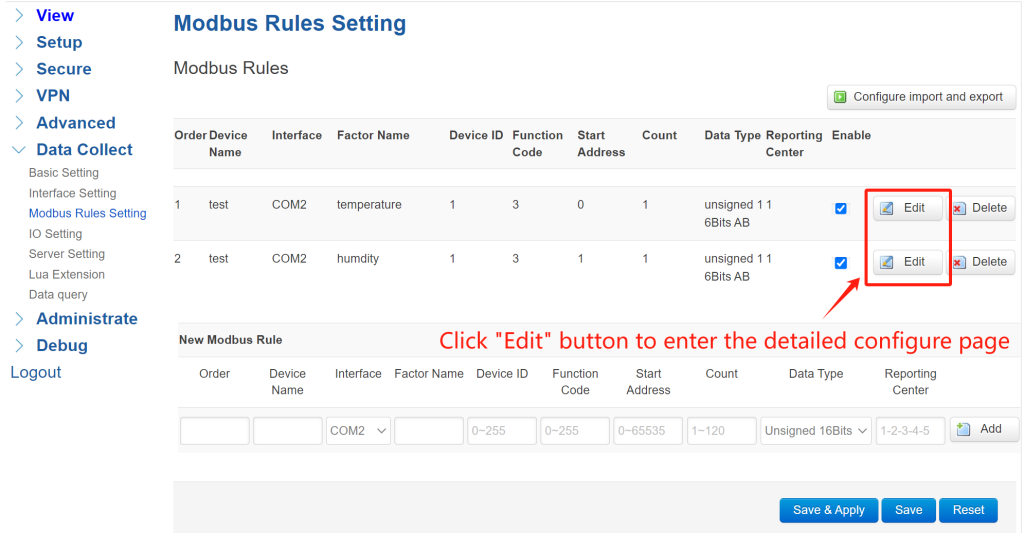
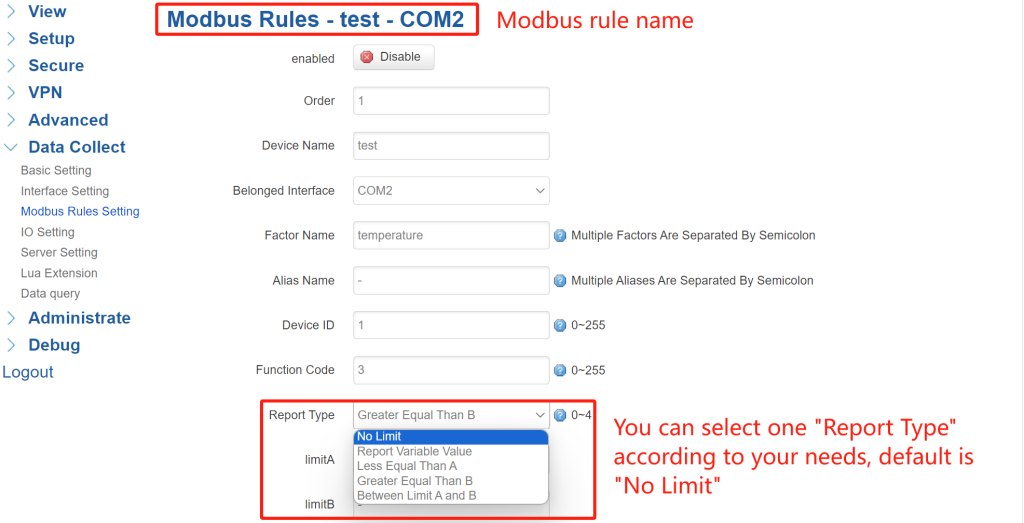
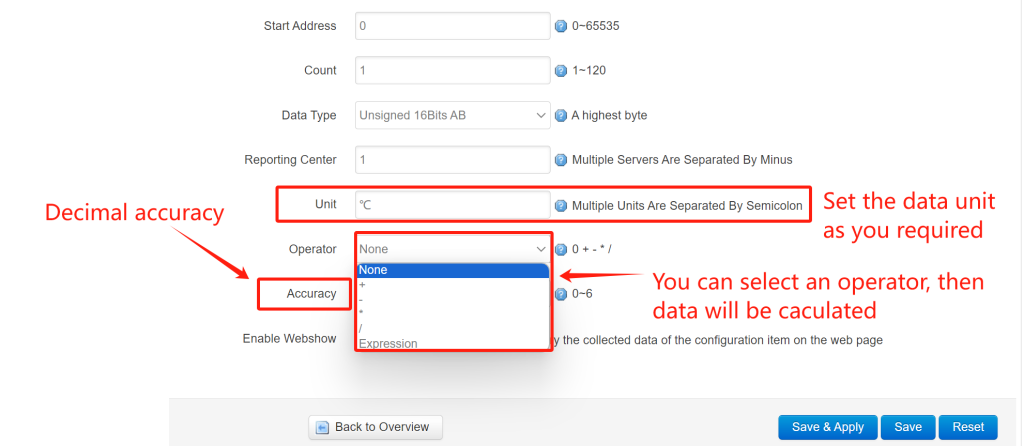
② Advanced Rule Configuration: After adding a rule, you can click its “Edit” for more options. Configure the extra parameters in this page.
You can set the data unit as you required, in this case, I set “℃” for temperature unit. Then you can select an operator for this rule. For example, I select the “Operator” as “+”, “Operand” set as “10”, then the calculated data should be “x=x+10”. After setup all extra parameters, click “Save&Apply”.
3. IO Setting
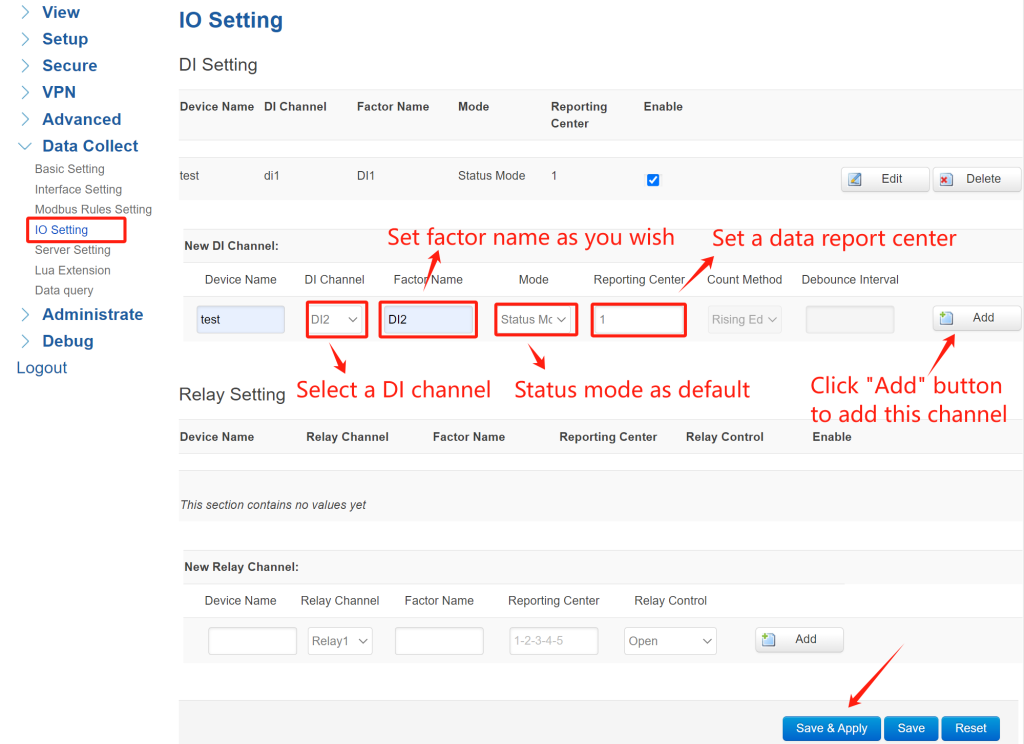
Navigate to Data Collect -> IO Setting. In this case, I’ll add 2 DI channels for monitoring the input signal. Select the DI channel of gateway, set a factor name as you wish, select “Status Mode” as default, set a data report center, then click “Add” to add this channel. After added, click “Save&Apply”.
4. Server Setting
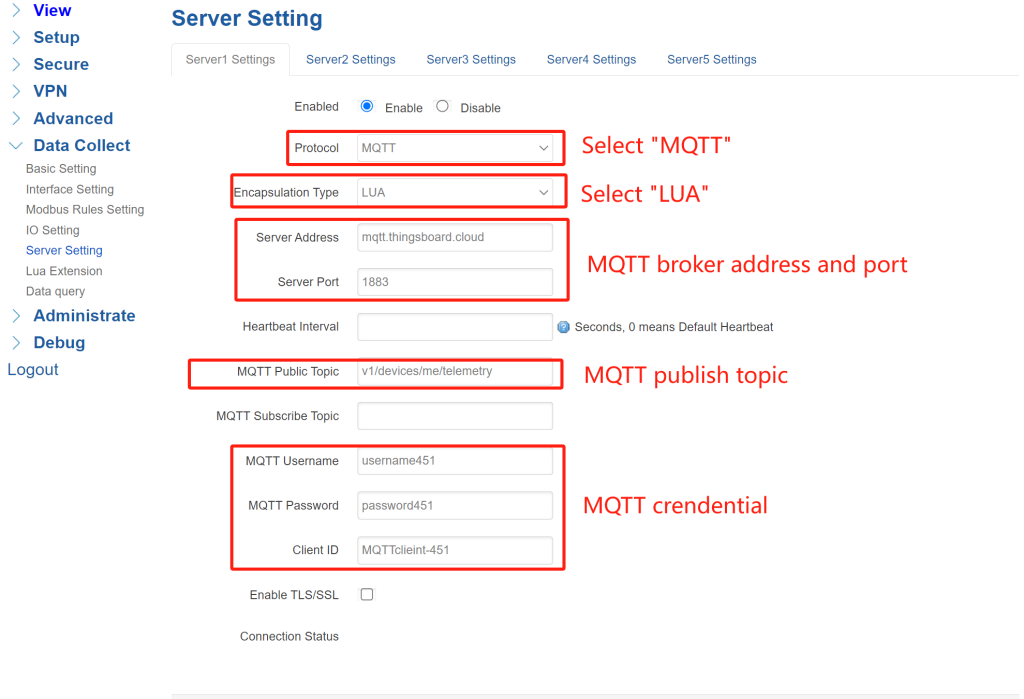
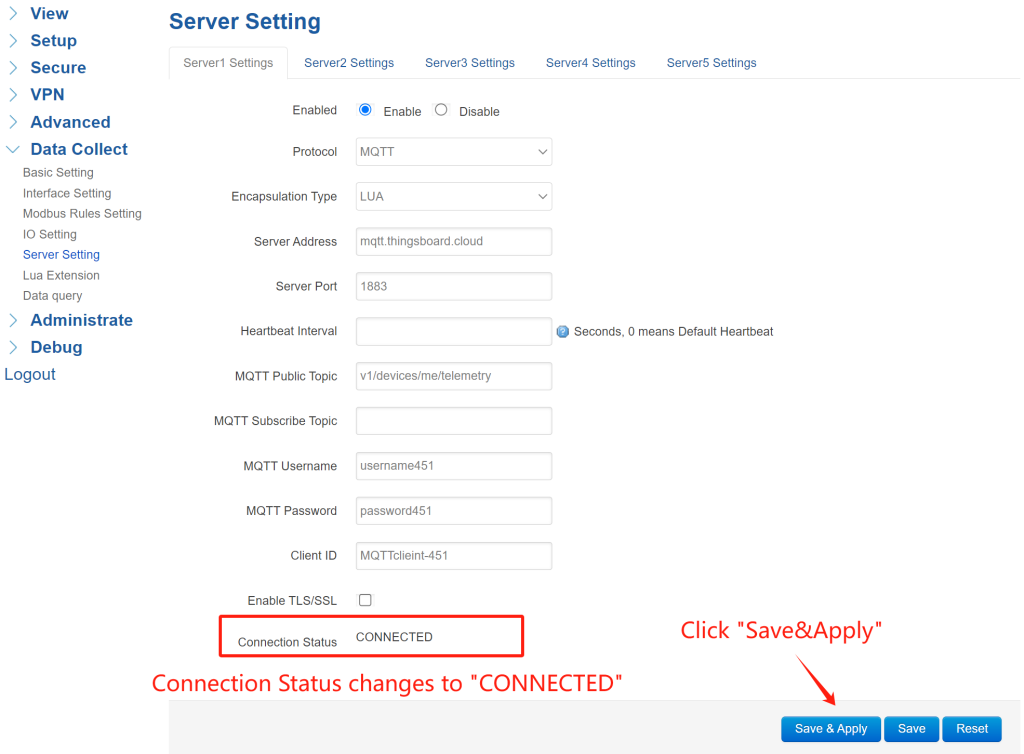
Navigate to Data Collect > Server Setting. You can configure up to 5 data report servers. Enable a server setting, “Protocol” select “MQTT”, “Encapsulation Type” select “LUA”. MQTT Server Address: “mqtt.thingsboard.cloud”, Server Port: “1883”. Set MQTT parameters according to ThingsBoard setting.
MQTT parameters of ThingsBoard platform:
After configured MQTT parameters, click “Save&Apply”, then the “Connection Status” will change to “CONNECTED”, it indicates the gateway has connected to the ThingsBoard platform successfully.
*Note: Since the ThingsBoard platform has specific requirements for the data reporting format, the standard JSON of gateway cannot meet the requirements, so I modified the gateway’s reporting format as “LUA” to adapt to the platform’s demands. This means that special firmware for gateway needs to be customized to connect to the platform.
Step 3: Verifying Data & Connectivity
1. Check Connectivity
Now, confirm your Bivocom gateway is communicating with ThingsBoard and transmitting data.
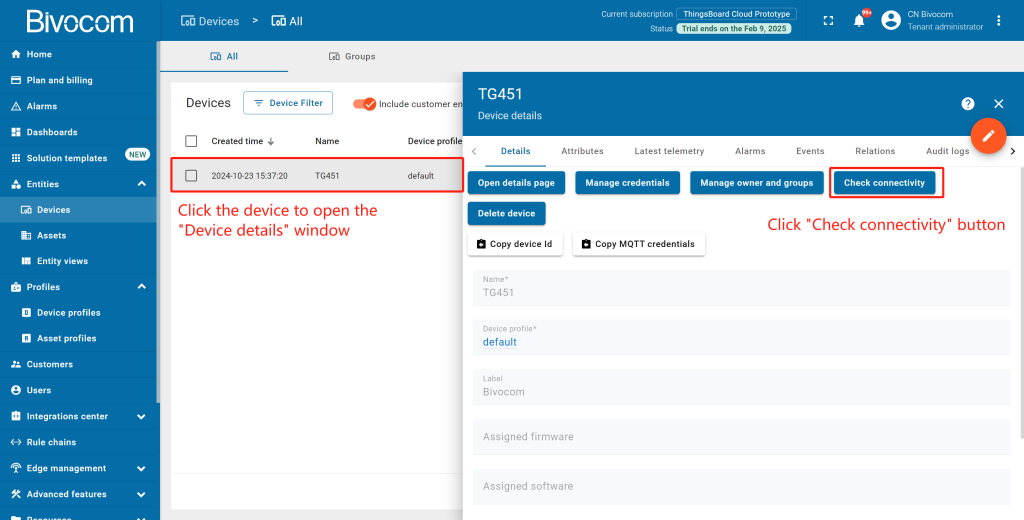
Return to your ThingsBoard, navigate to Devices. Go to the device’s detail page, and click the “Check connectivity” button. Select “Linux” as the operating system (Bivocom gateways run OpenWrt Linux) and follow the on-screen prompts (install client tools if needed). The device status will switch from “Inactive” to “Active” once the connection is confirmed.
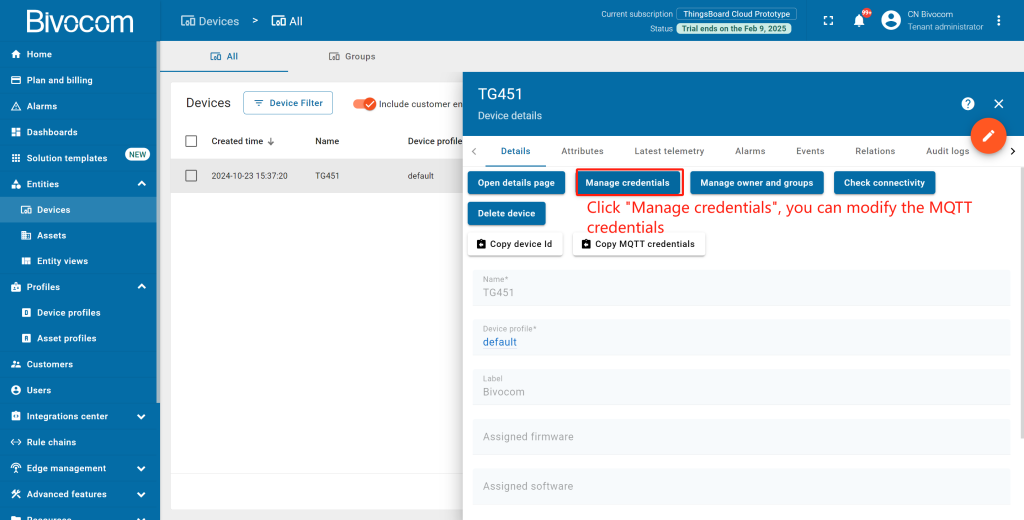
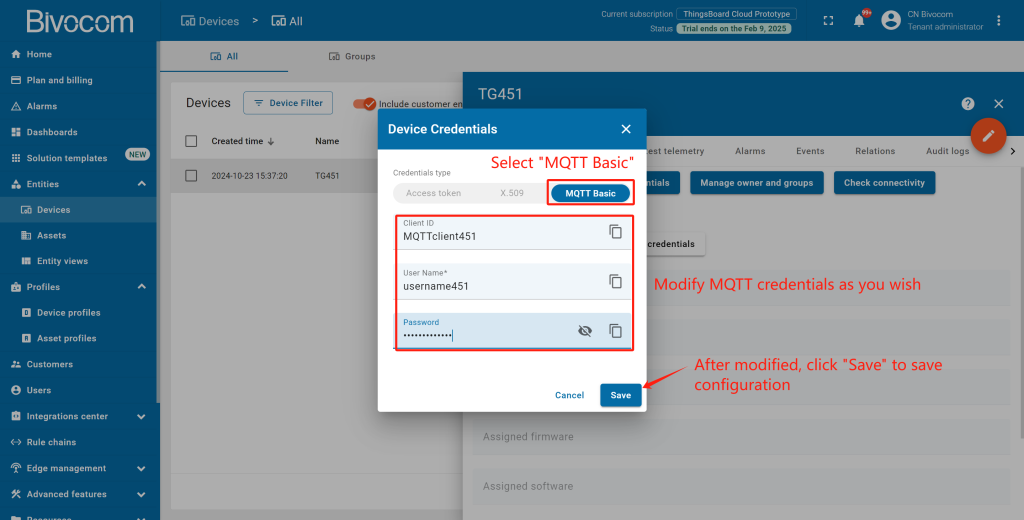
Optional: Click “Manage credentials” to edit MQTT settings later if needed. Enter “Device Credentials” page, select “MQTT Basic”. Then you can modify the MQTT Client ID, Username and Password as you wish. After modified, click “Save” to save the configuration.
2. Data Transmission
Now, the gateway has already connected to ThingsBoard platform. Meanwhile, the gateway can work as a data logger to collect sensor data. Next step, let’s send data from the gateway to ThingsBoard to validate the integration. We’ll use Mbslave to simulate Modbus data (skip this if using real sensors). In the above steps, we already added the Modbus rules for gateway configuration. Now, it’s time to configure the Modbus slave.
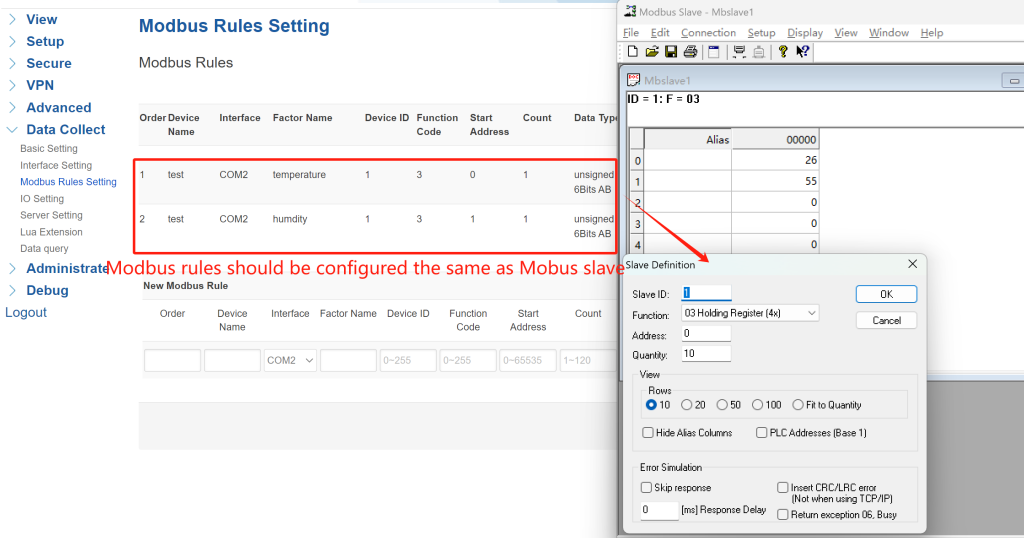
① Slave Definition:
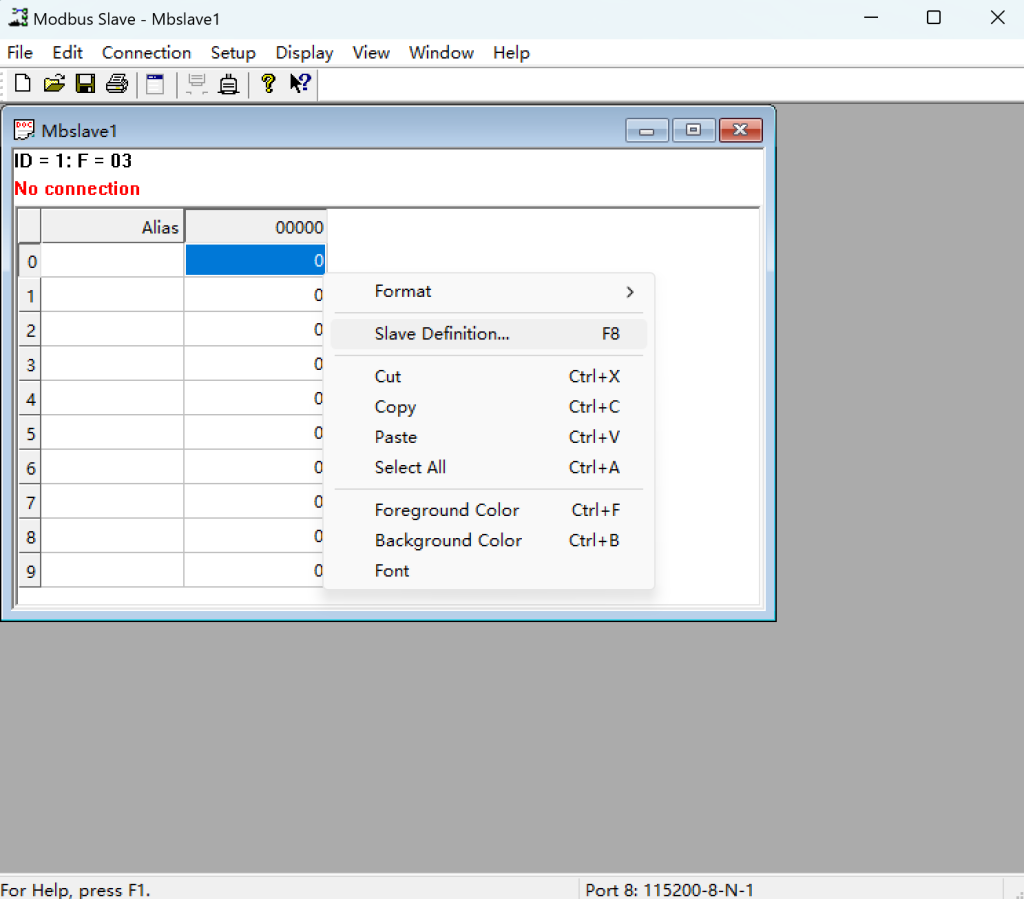
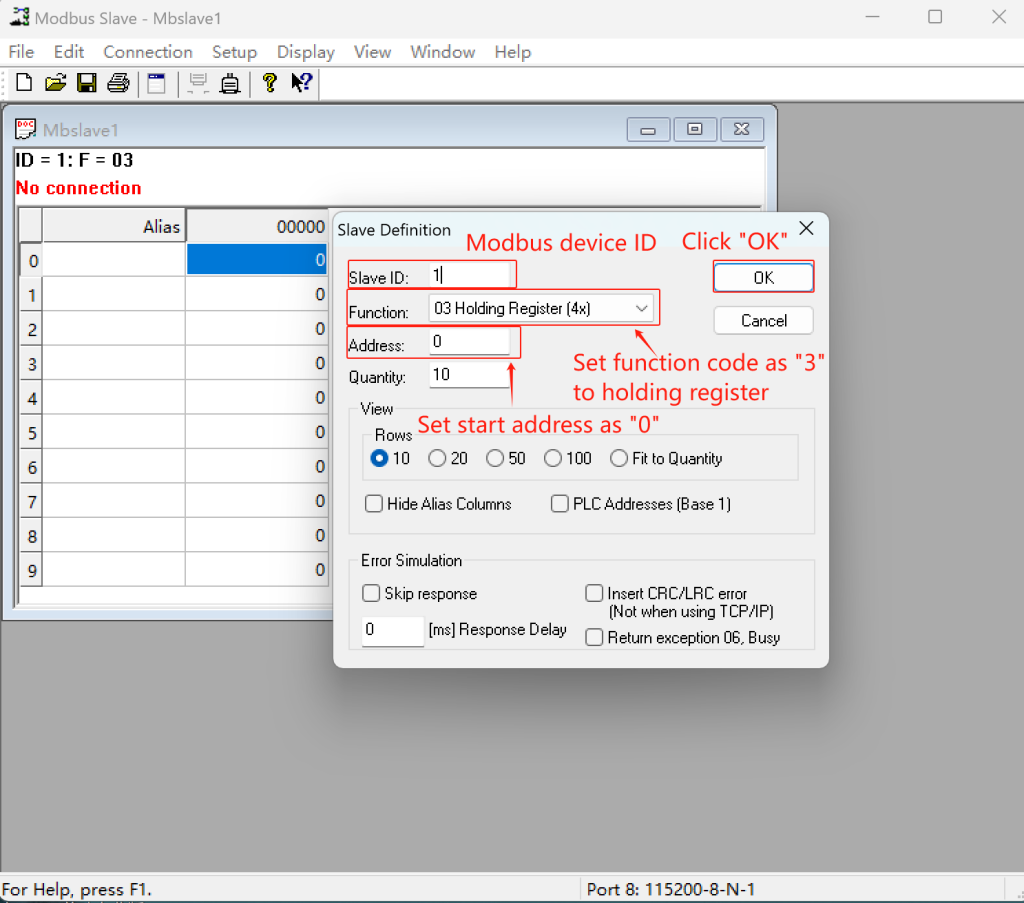
- Open Mbslave and right-click to select “Slave Definition”.
- Set Slave ID = 1, Function Code = 3 (Holding Register), and Start Address = 0 (or others as you wish). After, click “OK”.
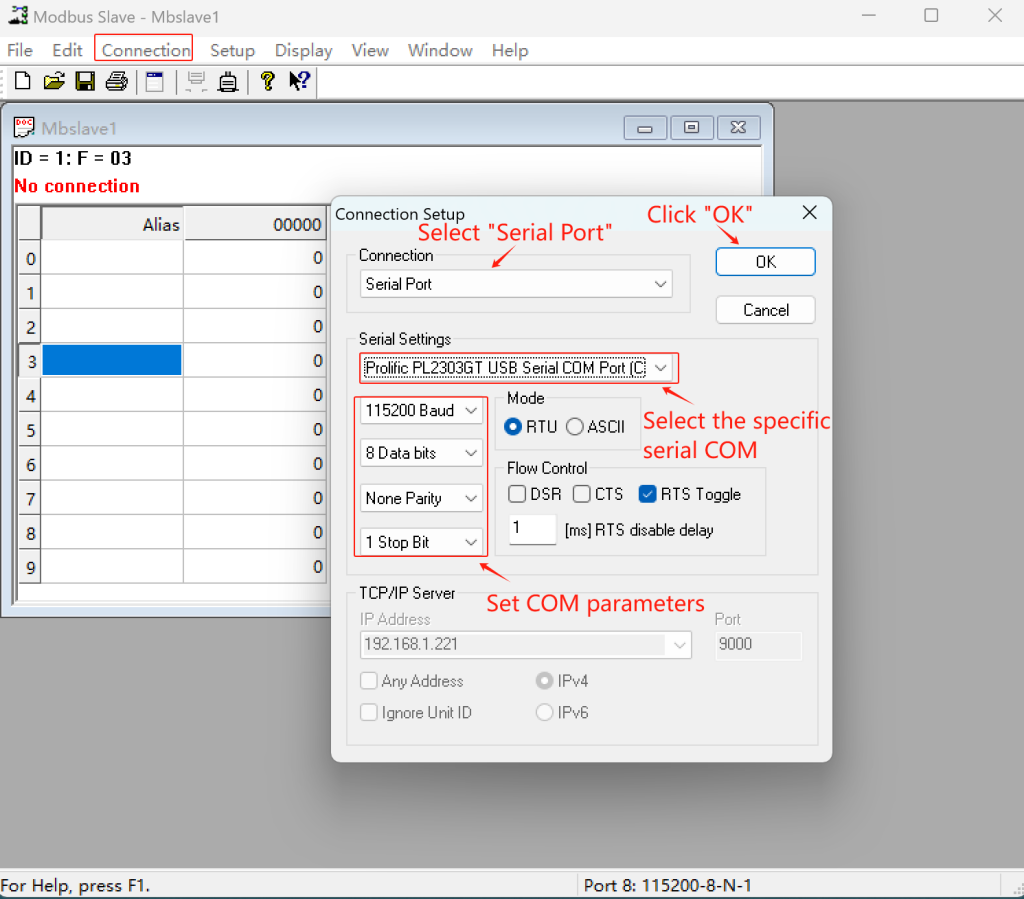
② Connection Setup: Navigate to Connection > Connection Setup, select “Serial Port” (Since I use RS232 to connect gateway with Modbus slave), and match the COM parameters (baudrate, data bits) with your gateway.
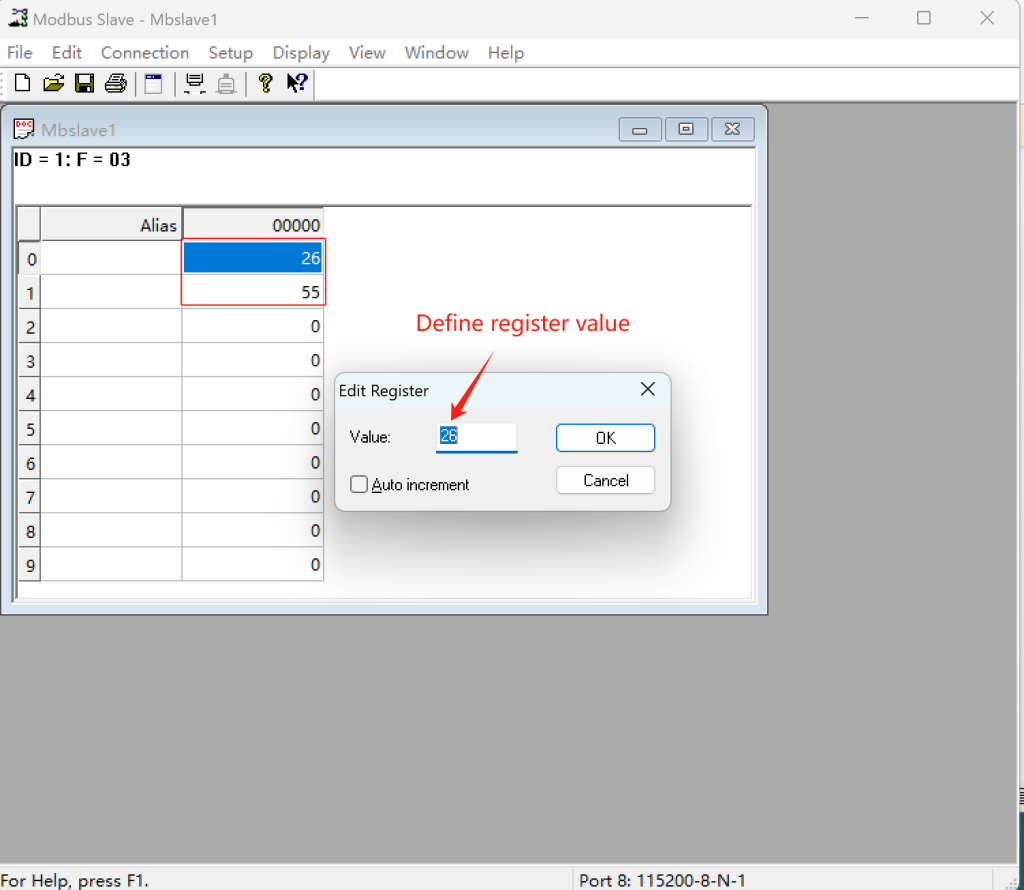
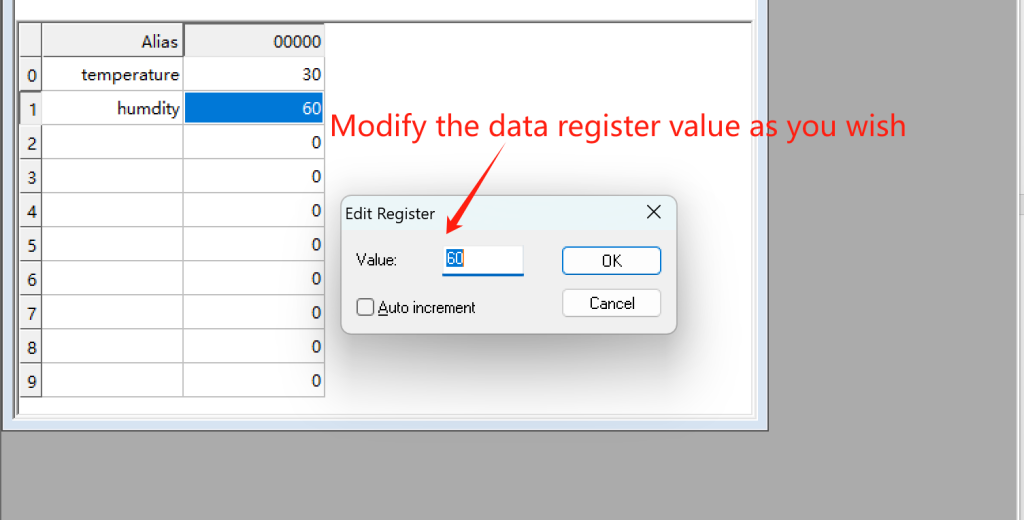
③ Define Register Value: Edit and define the specific register as you wish. In this case, I set 2 registers, register 0 and 1.
Note: Since the Modbus slave is a simulate tool for Modbus data, you can set the parameters as you wish. After setup Modbus slave, the Modbus rules setting of gateway must be configured the same as Mbslave.
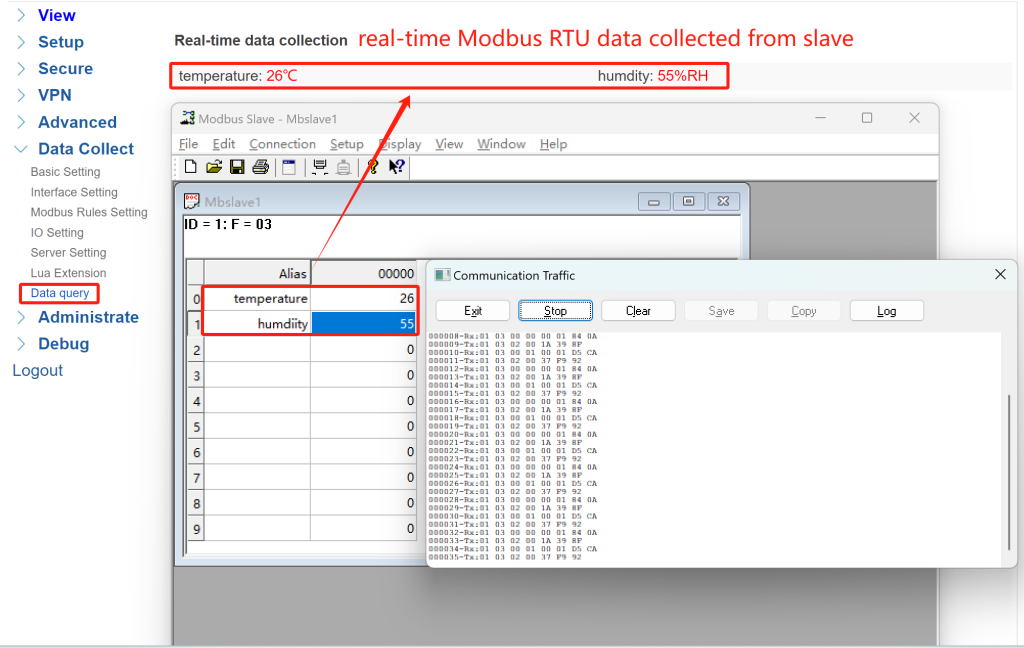
④ Validate: Back to WEBUI of your gateway, navigate to Data Collect > Data query to view real-time collected data.
3. Telemetry Data
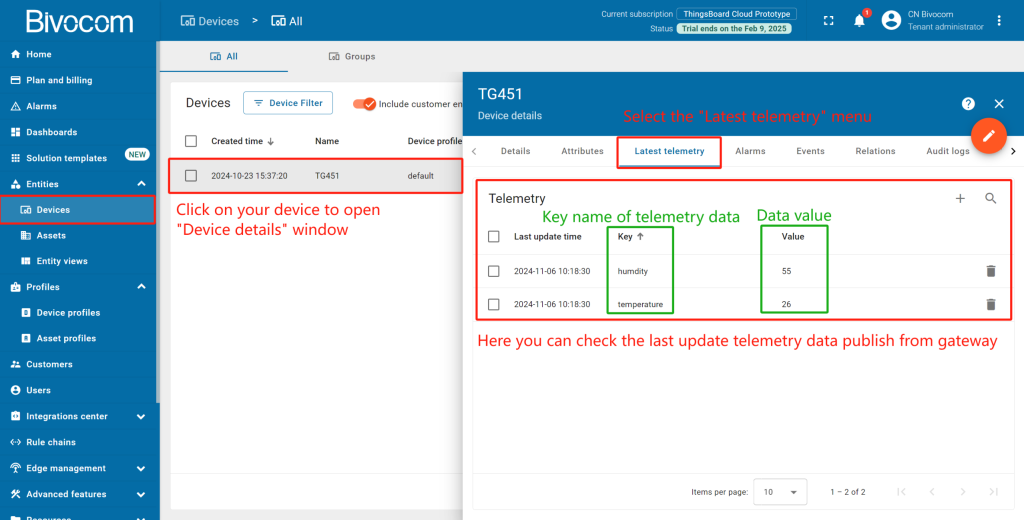
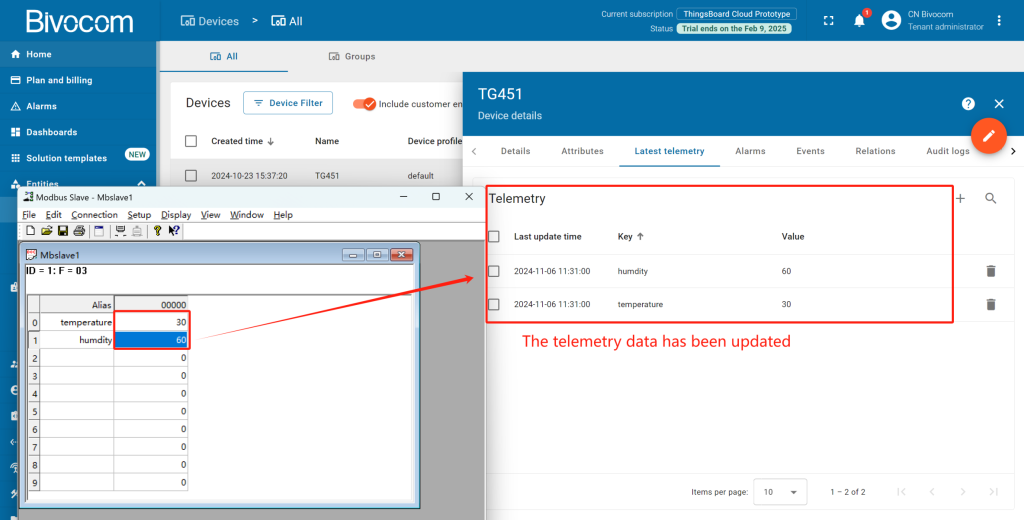
Back in ThingsBoard and navigate to Devices. Open your device’s and click “Latest telemetry” . It’ll show the last update telemetry data in the opened window.
Now, I’m able to modify the Modbus data through the Mbslave, I can change the data to whatever I want.
Then back to the platform, check whether the data has been updated. Get into “Device detail” page, you can see the telemetry data has been successfully changed the same as Mbslave.
Step 4: Create an Interactive Monitoring Dashboard
Turn your data into actionable insights with a custom dashboard—one of the key benefits of Bivocom ThingsBoard Integration.
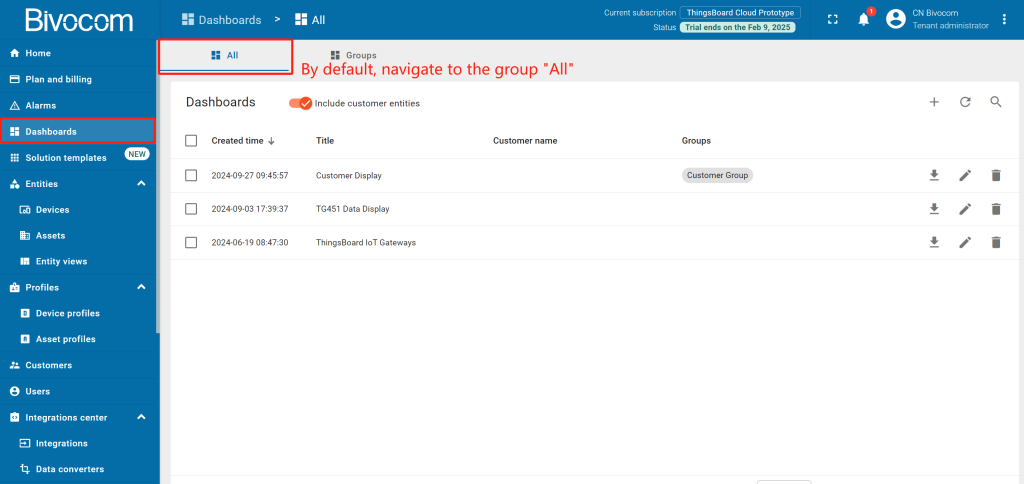
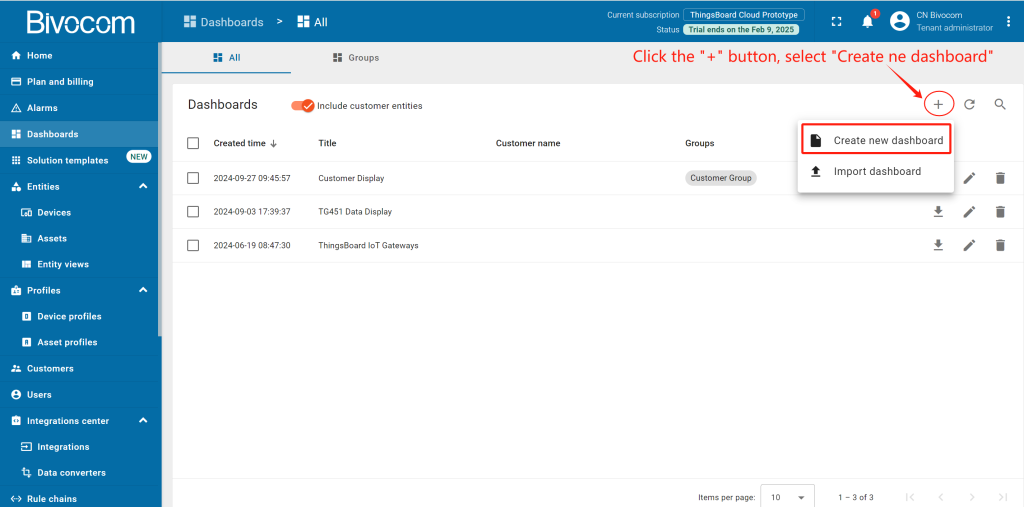
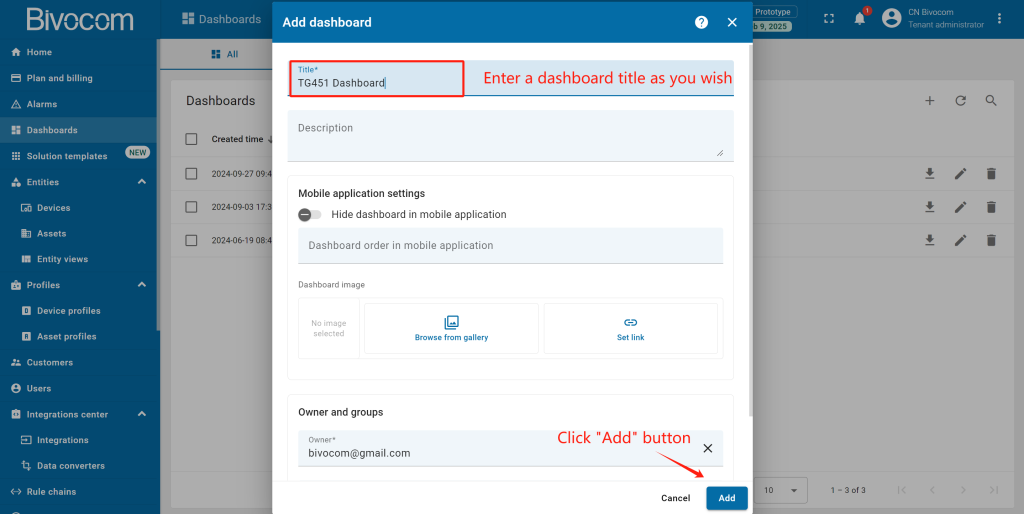
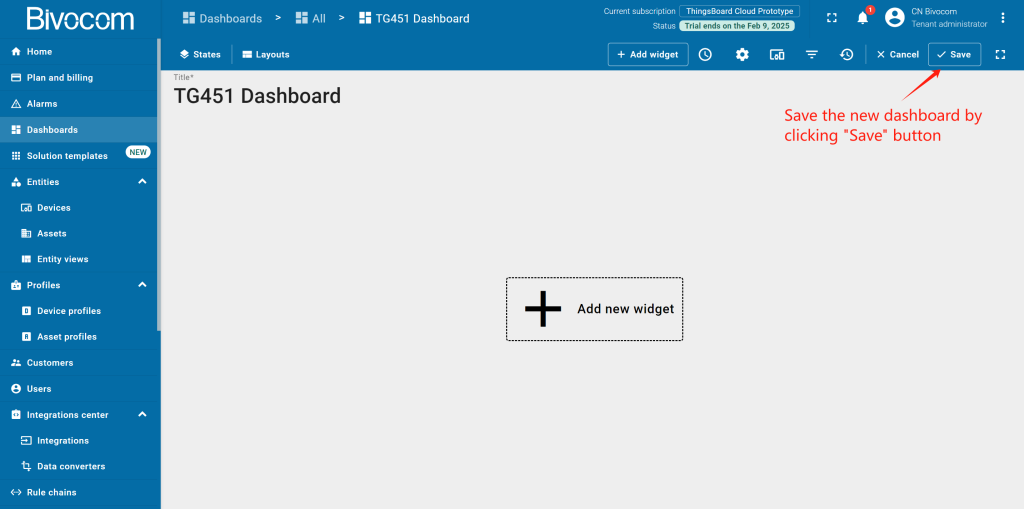
Navigate to Dashboards > All. Click “+” and choose “Create new dashboard”. Enter a dashboard name (the description is optional) and click “Add”. After creating the dashboard, it will open automatically, and you can immediately start adding widgets to it. To save the dashboard, click “Save” button in the upper right corner.
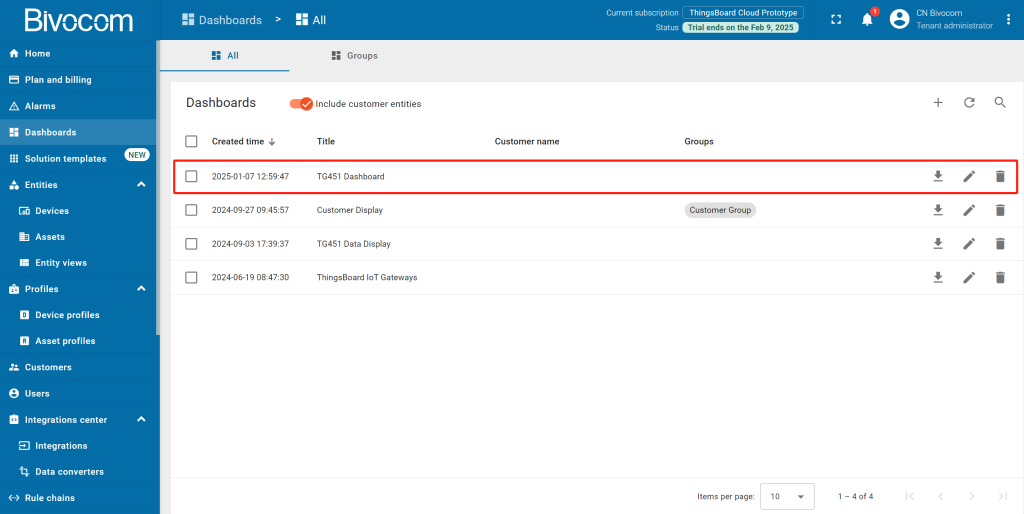
The new dashboard has been successfully created. As you continue to add new dashboards, they will appear at the top of the list. This default sorting is based on the creation timestamp.
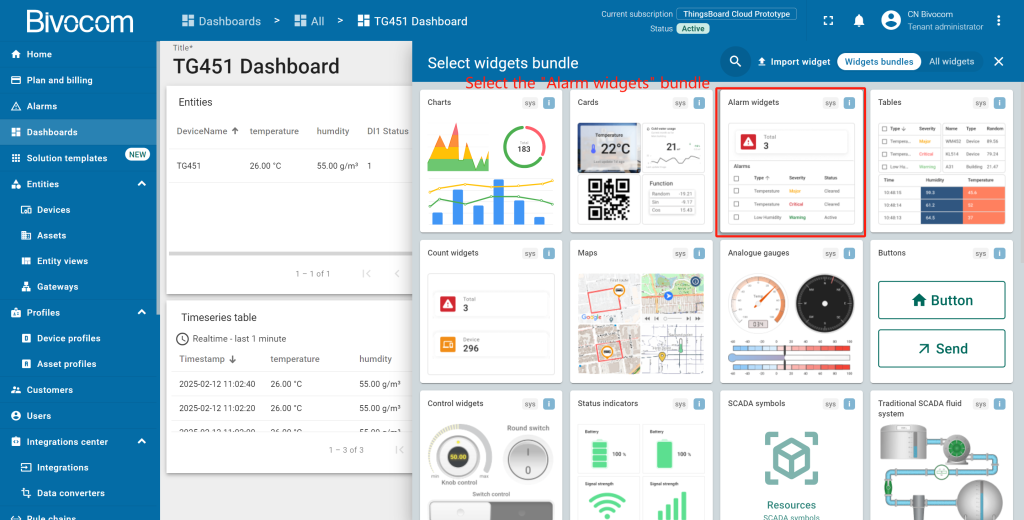
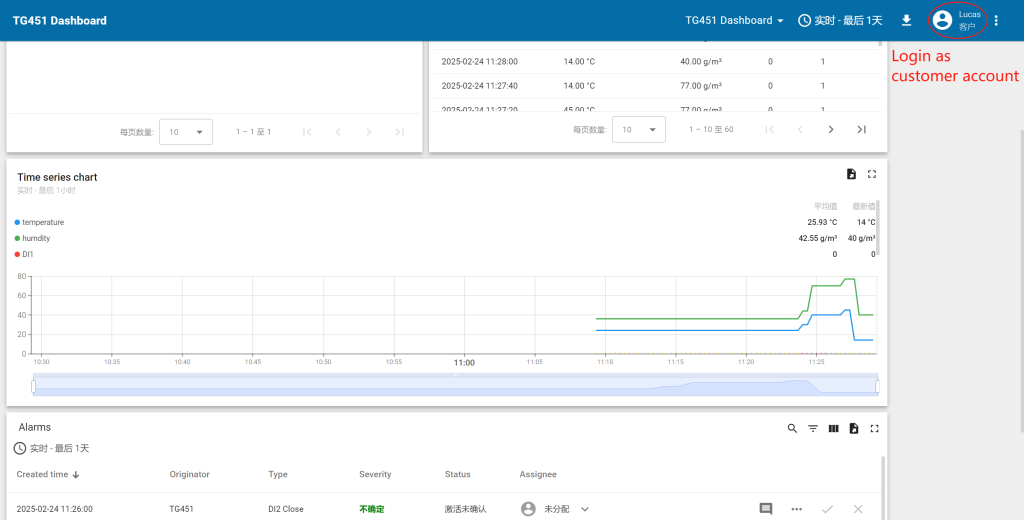
Next, you’ll add core visualization widgets— a standout benefit of Bivocom ThingsBoard Platform Integration that turns raw hardware data into actionable, easy-to-read insights. The drag-and-drop setup (no coding required) is one of the partnership’s biggest time-savers:
- Entities table widget: Summarizes telemetry data (e.g., temperature, humidity) from your Bivocom gateway and linked devices. Perfect for a device overview. Customize columns to highlight critical metrics, and enable real-time refreshes to track device status at a glance.
- Time series chart widget: Maps data trends over your chosen window. This makes it simple to spot anomalies that might signal sensor issues or operational risks.
- Alarms table widget: Centralizes threshold-based alerts (e.g., high temperature) and links them directly to the triggering Bivocom device, cutting down on fault-finding time.
These widgets are highly configurable. You can drag to resize them, link them to specific data keys from your devices. In minutes, you’ll have a functional, tailored monitoring panel.
Since detailed widget customization (e.g., styling, advanced data filtering) and dashboard features (e.g., multi-user sharing) deserve deeper coverage, we’ll explore these in a follow-up article–“Bivocom ThingsBoard Platform Integration | Dashboard Customization”. It will break down how to optimize panels for industry-specific use cases (e.g., energy grid monitoring, factory floor oversight).”
Professional Support & Services
Elevate your industrial IoT deployments with dedicated support for Bivocom ThingsBoard Platform Integration. Our joint support framework—tailored to sectors like industrial automation, energy utilities, and smart cities—ensures seamless hardware-platform connectivity, reliable data flow, and optimized performance through three core pillars:
- Expert Technical Guidance: Direct setup help and troubleshooting for reliable data flow.
- Tailored Integration Solutions: Tailored adaptations for specific protocols and challenging environments.
- Comprehensive Resource Hub: Step-by-step guides and configuration templates for faster deployment.
Ready to deploy your integrated solution?
Contact our solutions team at [email protected] for a personalized consultation. With Bivocom, you gain more than hardware—you secure a trusted partner in building scalable, data-driven industrial IoT systems.





Comment